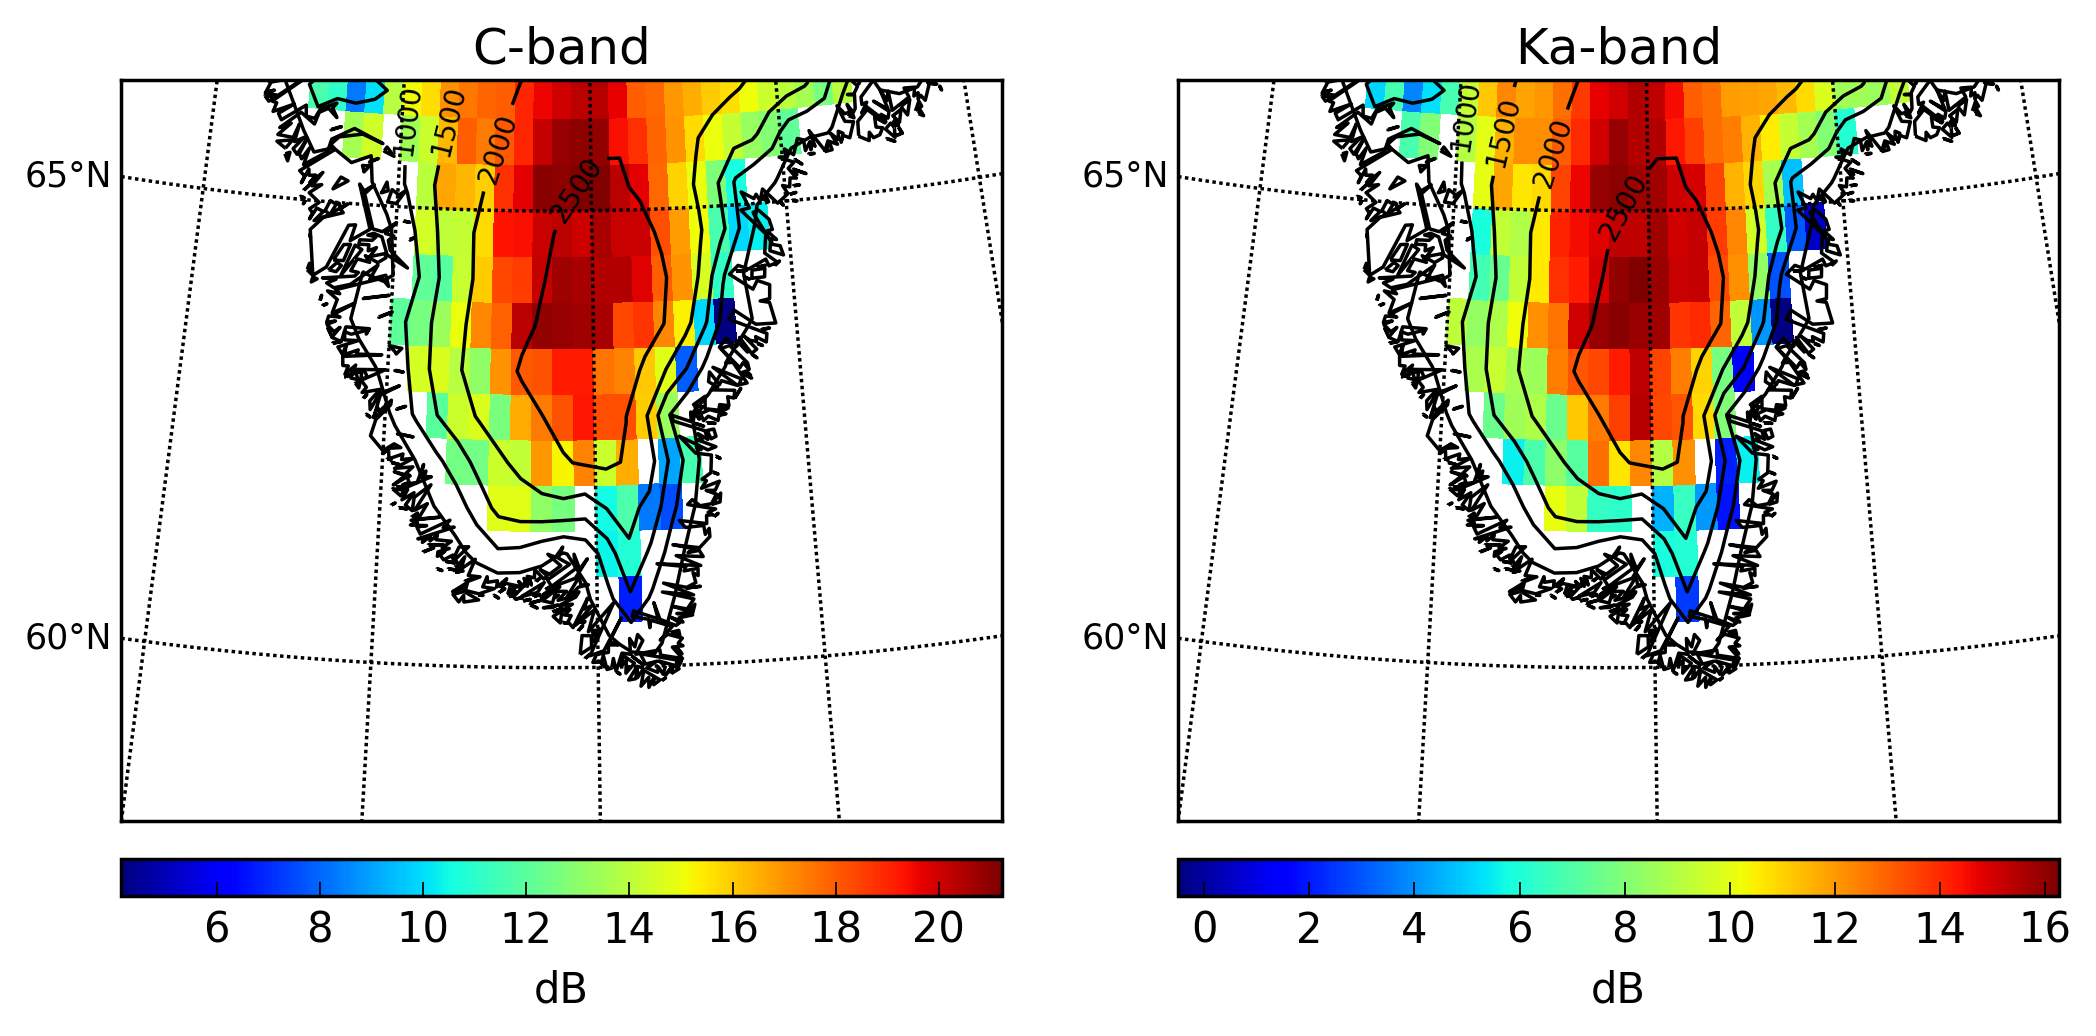
Spatially gridded and temporally averaged radar backscatter measurements over the Greenland ice sheet 1993-2015 (made using matplotlib)
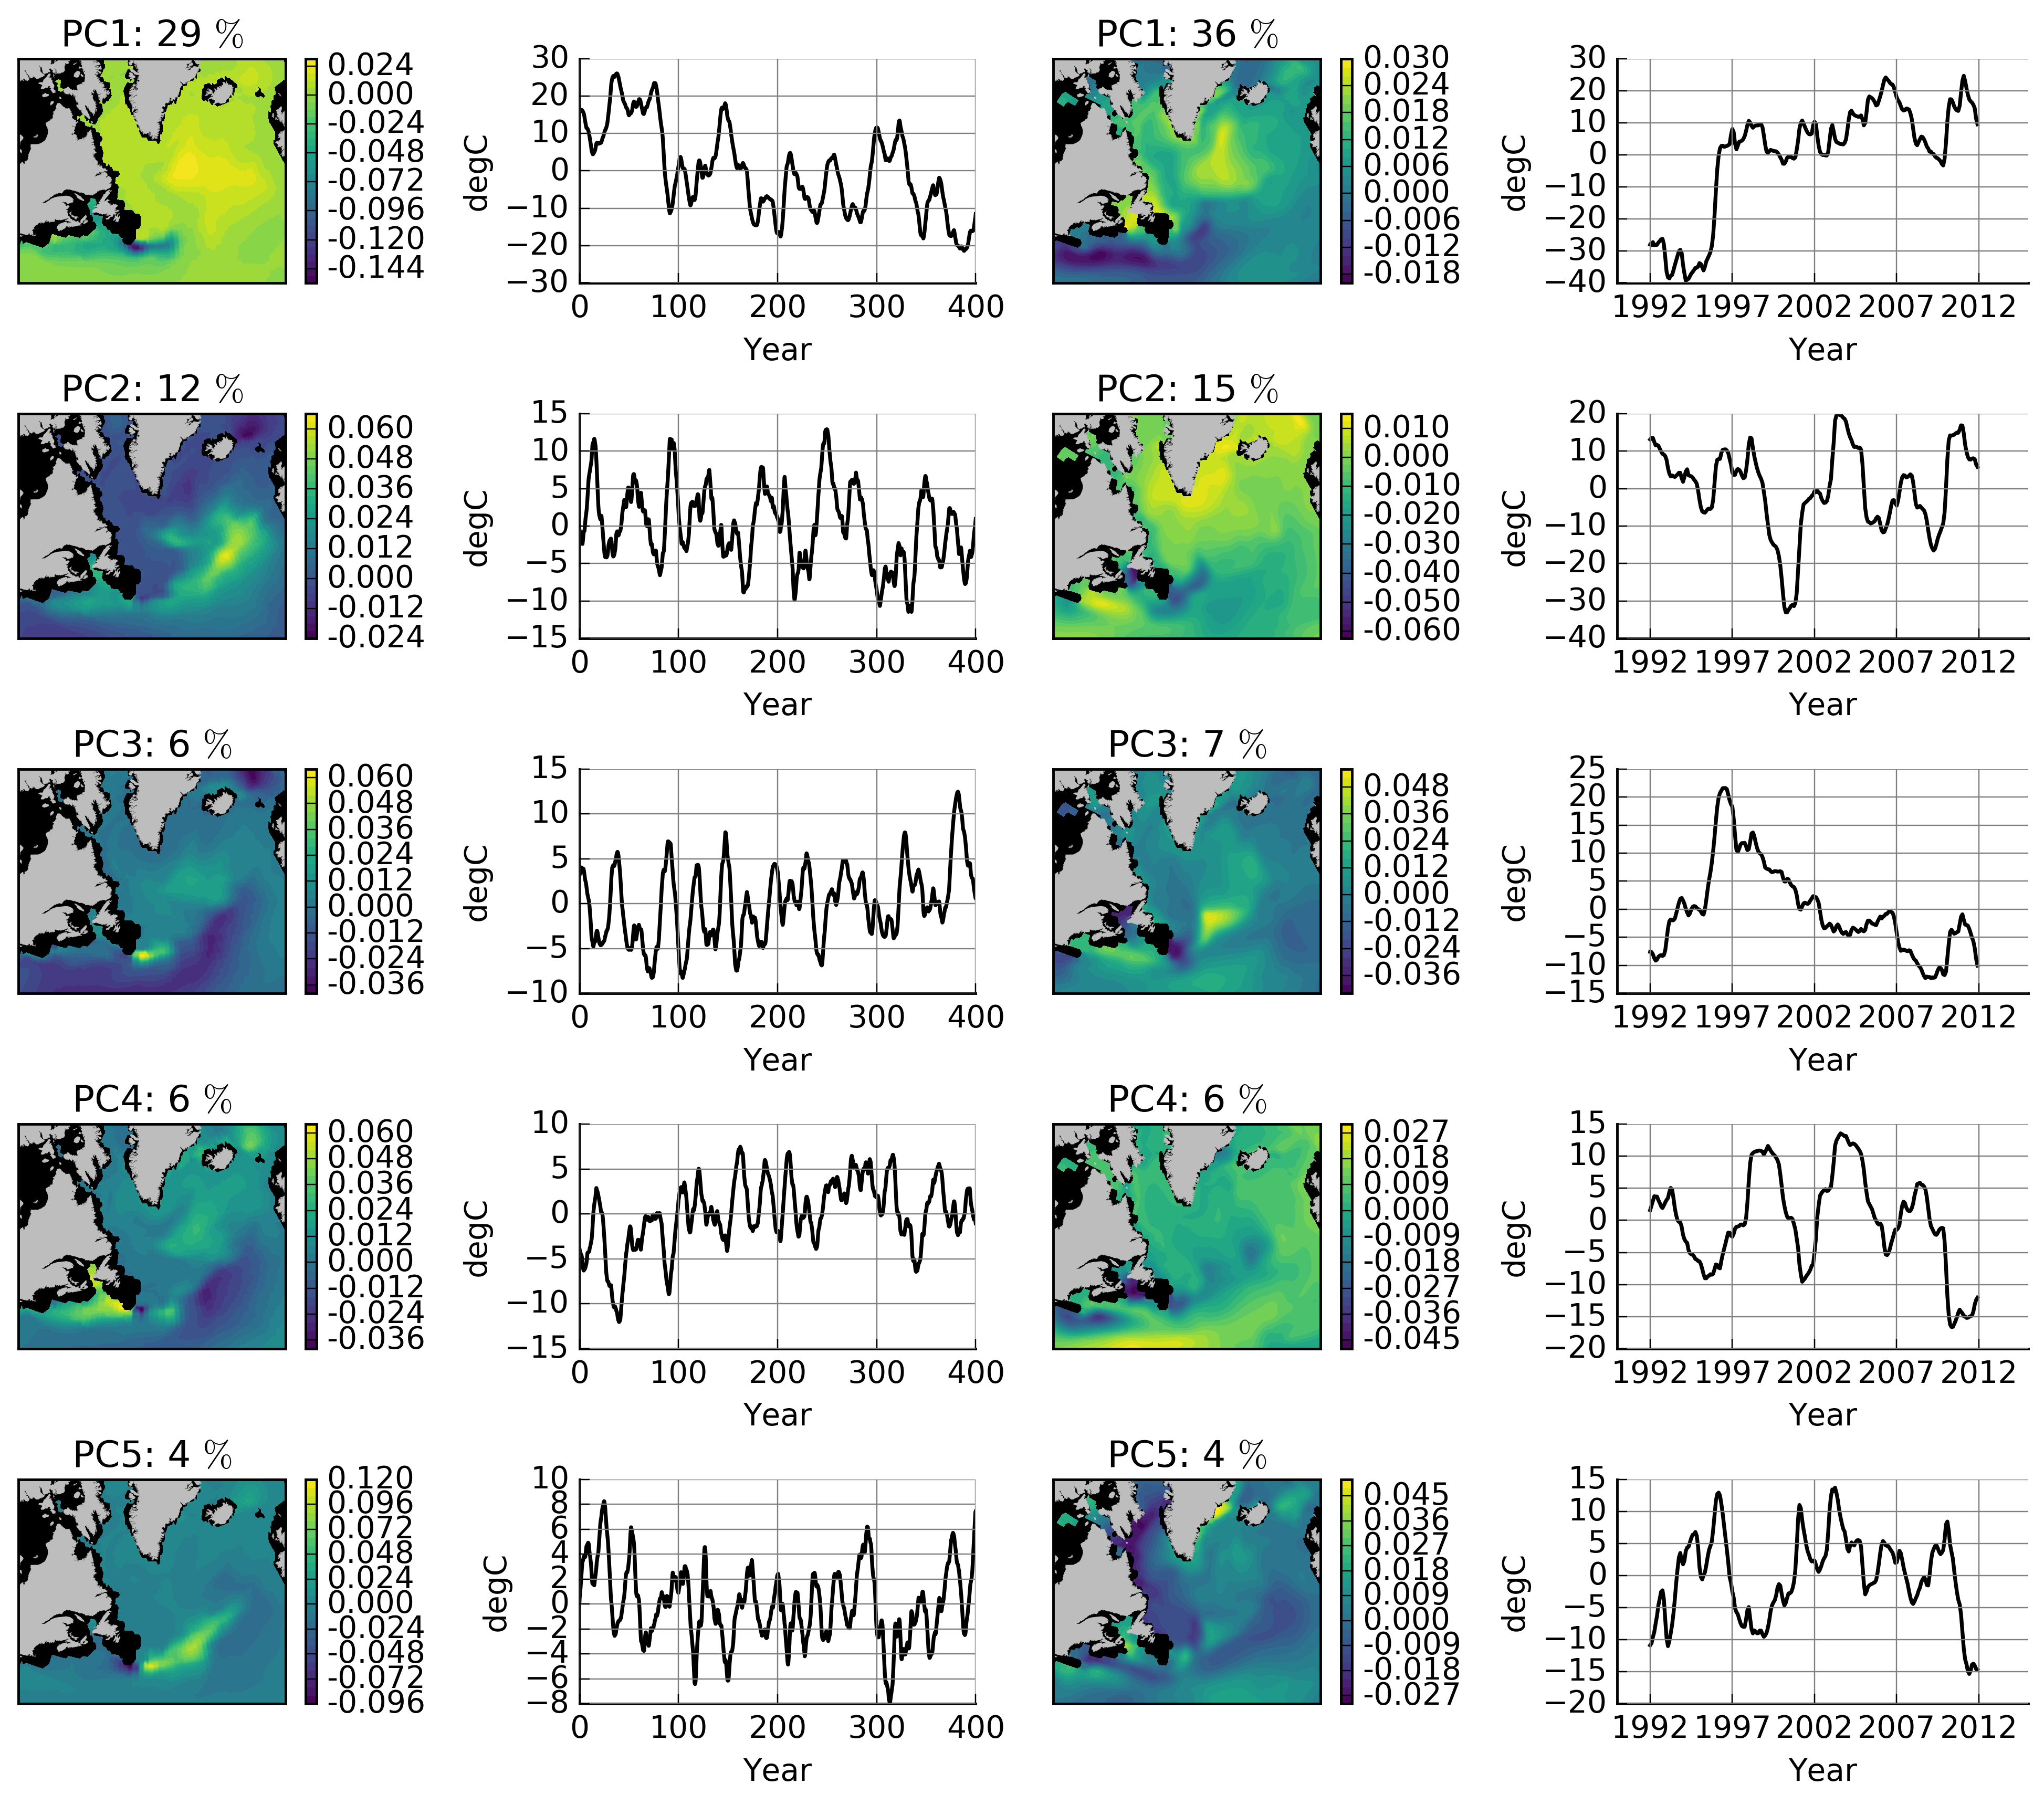
Principal component analysis of ECCO ocean reanalysis data (analysis using numpy and python eof package, plotting using matplotlib)
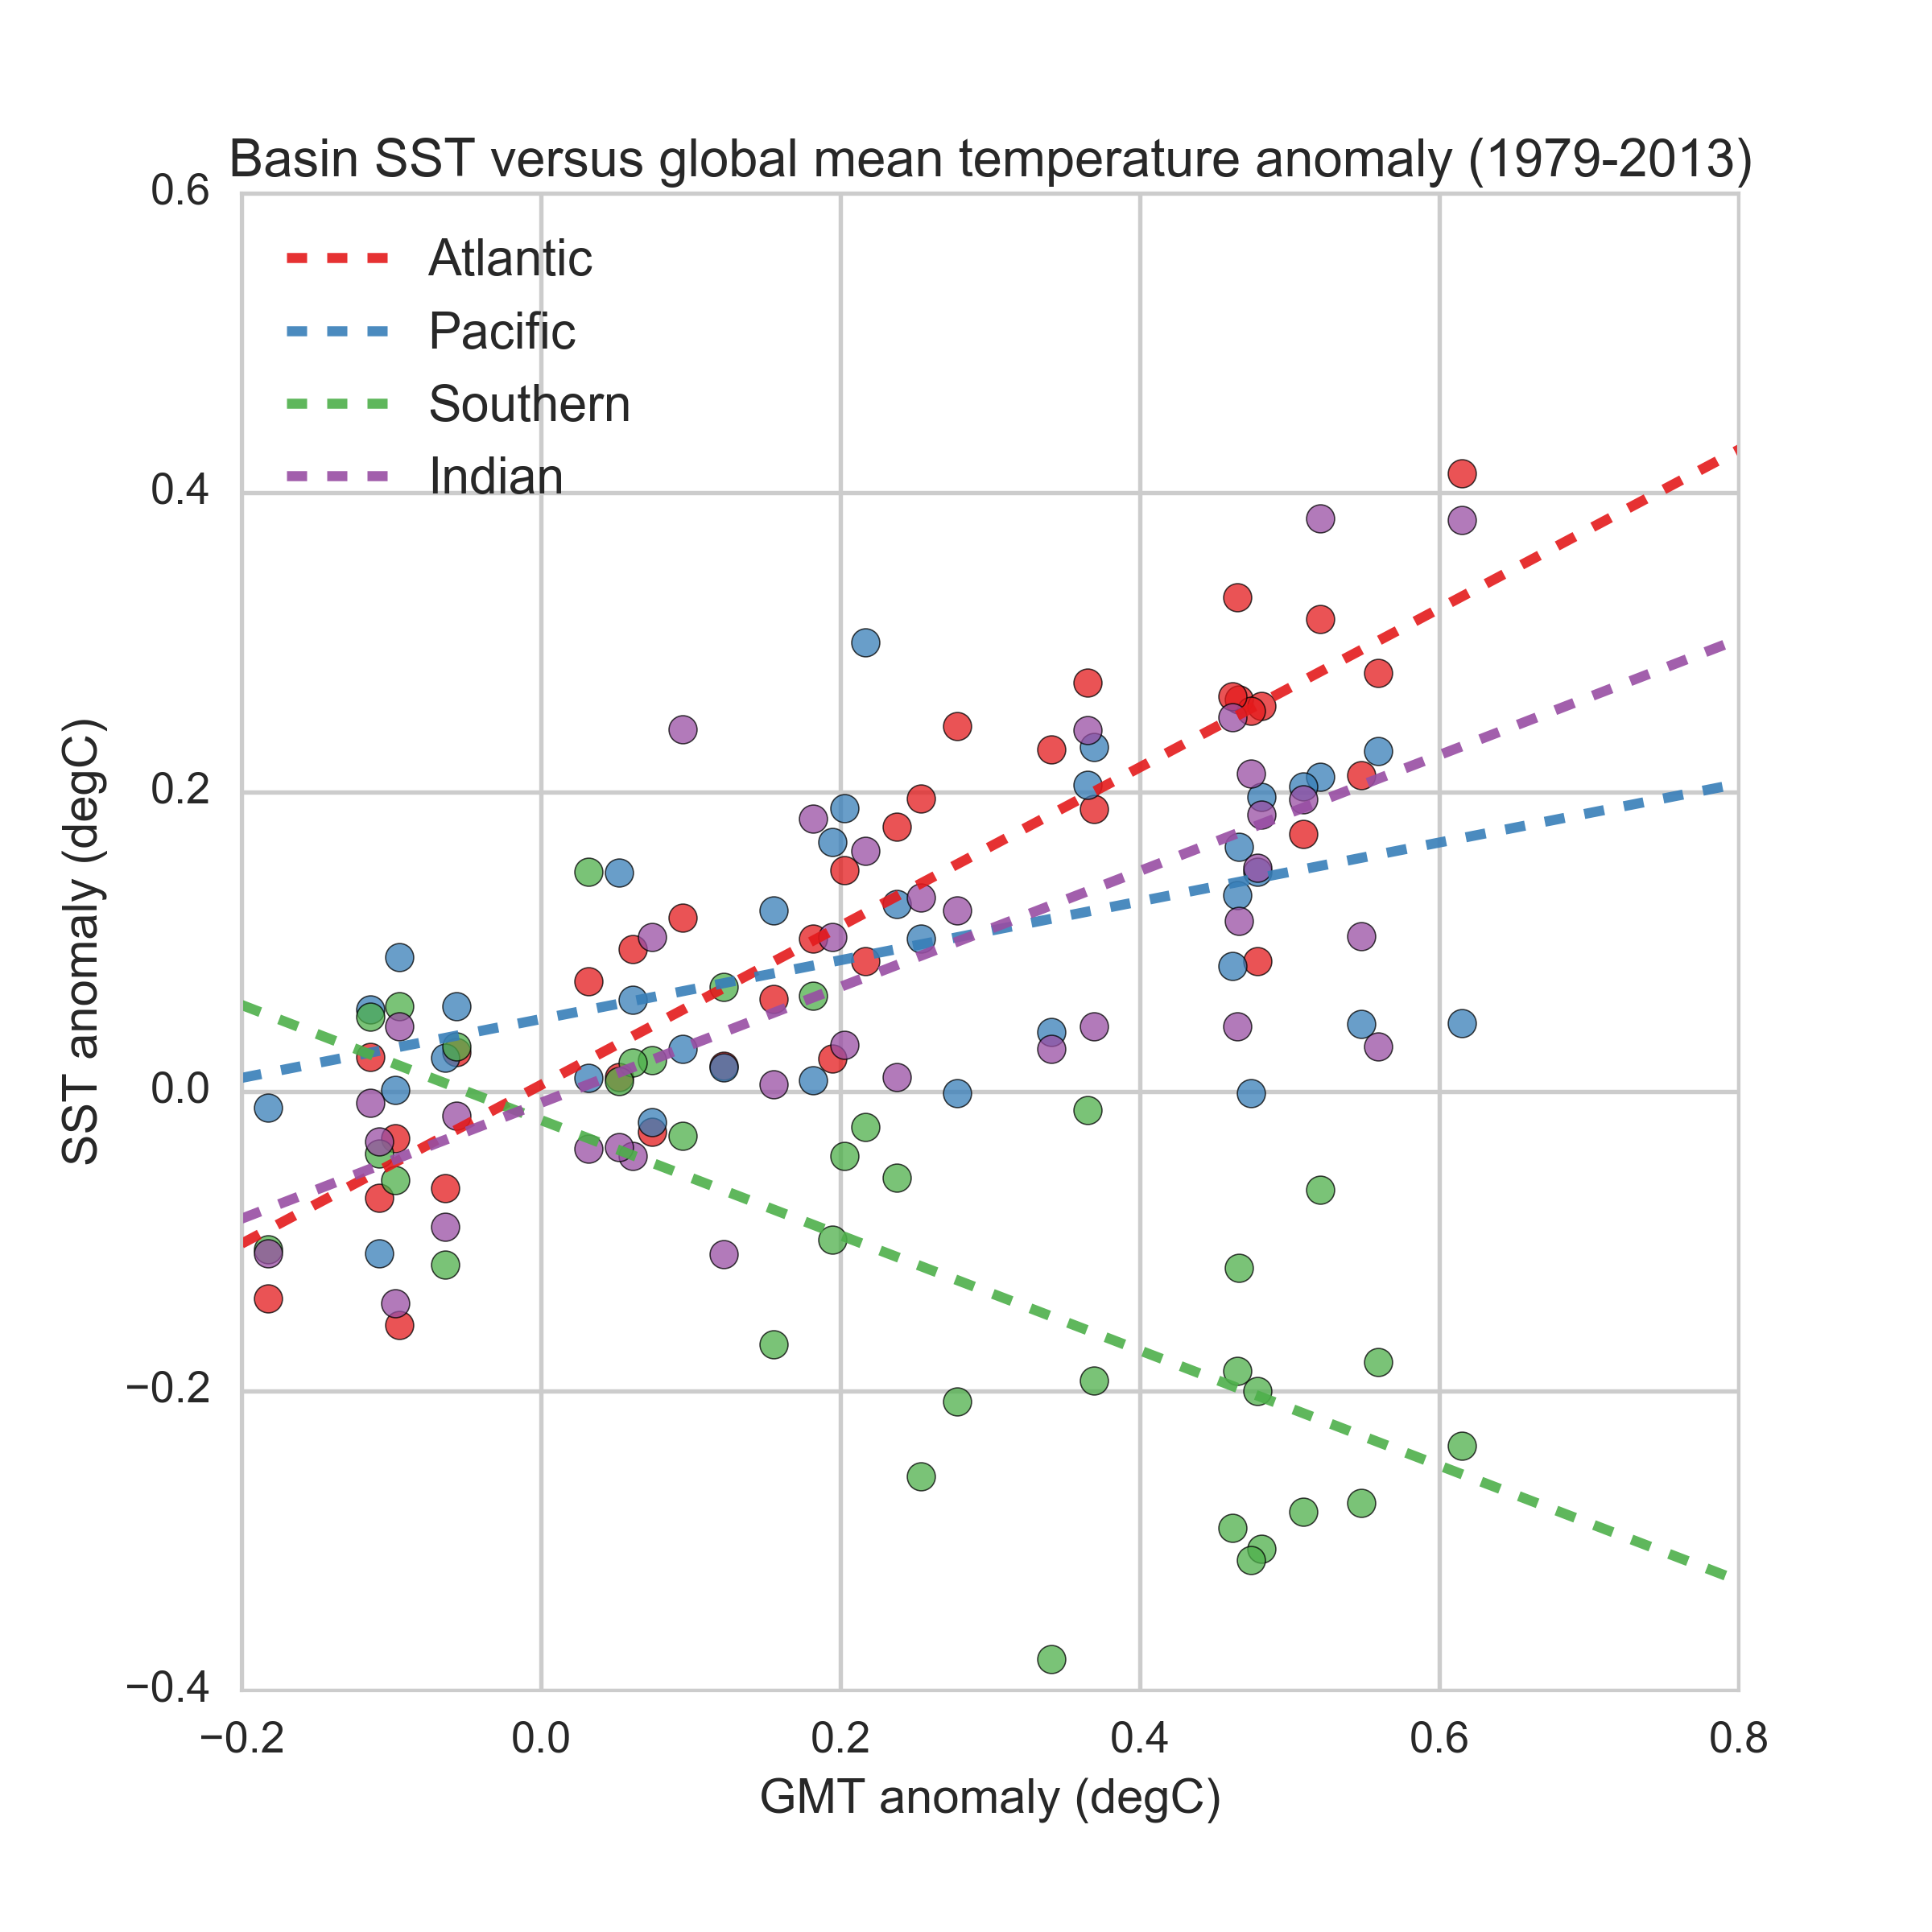
Ocean basin sea surface temperature anomalies versus global mean temperature (analysis in numpy, plotting using matplotlib)
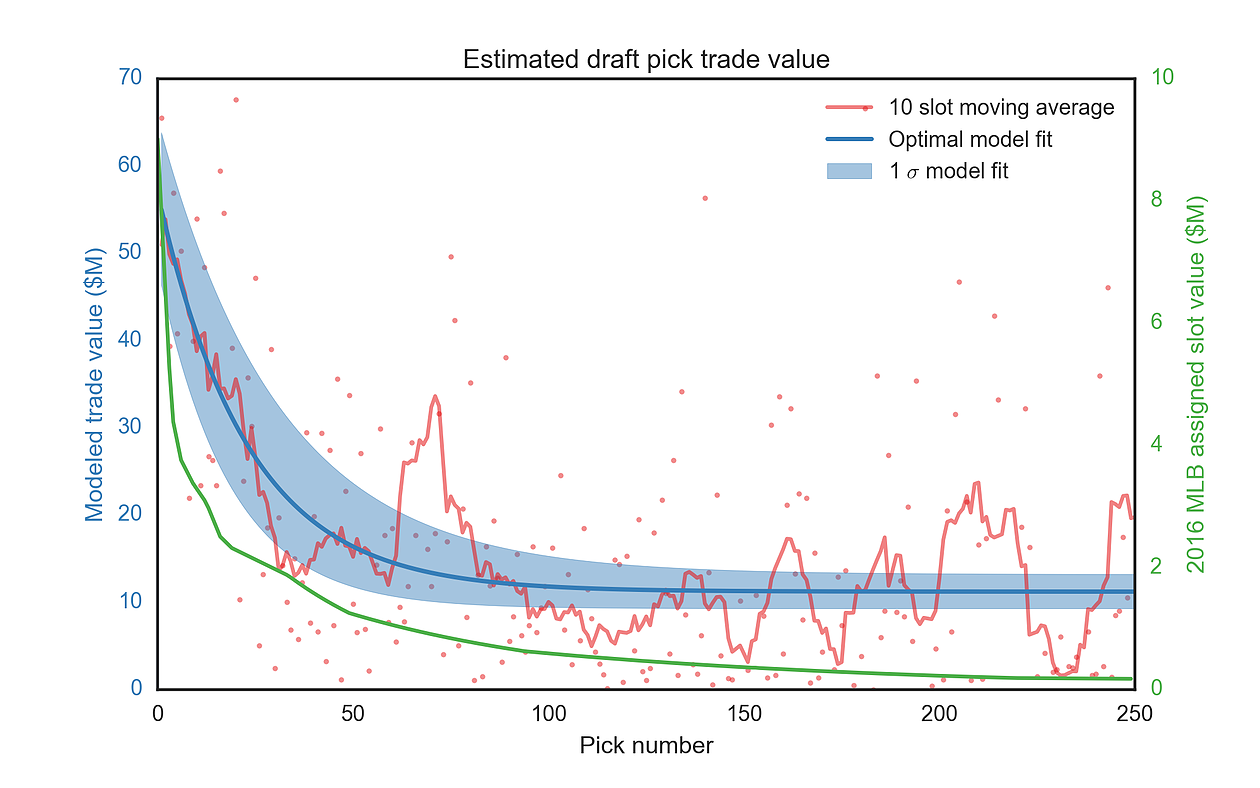
Results of MLB draft pick trade model (numpy, scikit-learn, matplotlib)
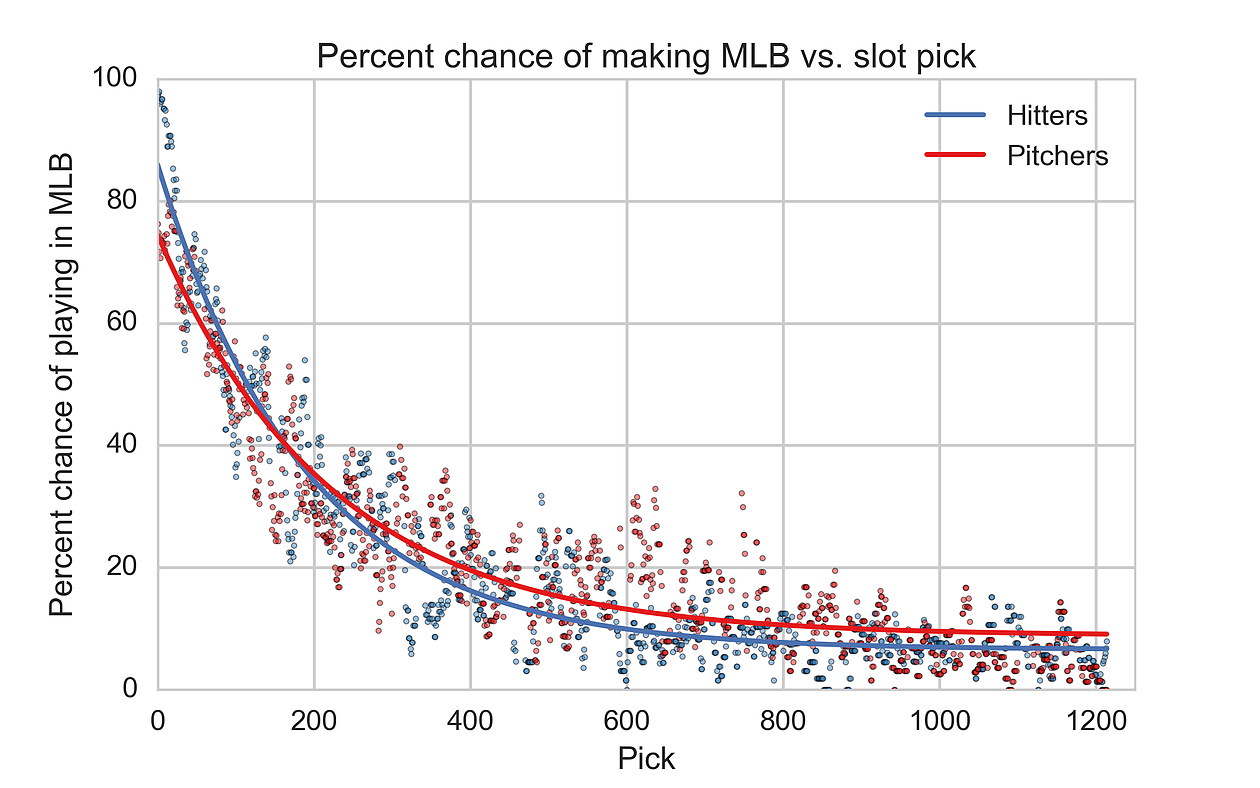
MLB draft position and chance of playing in a major league game (numpy, scikit-learn, matplotlib)
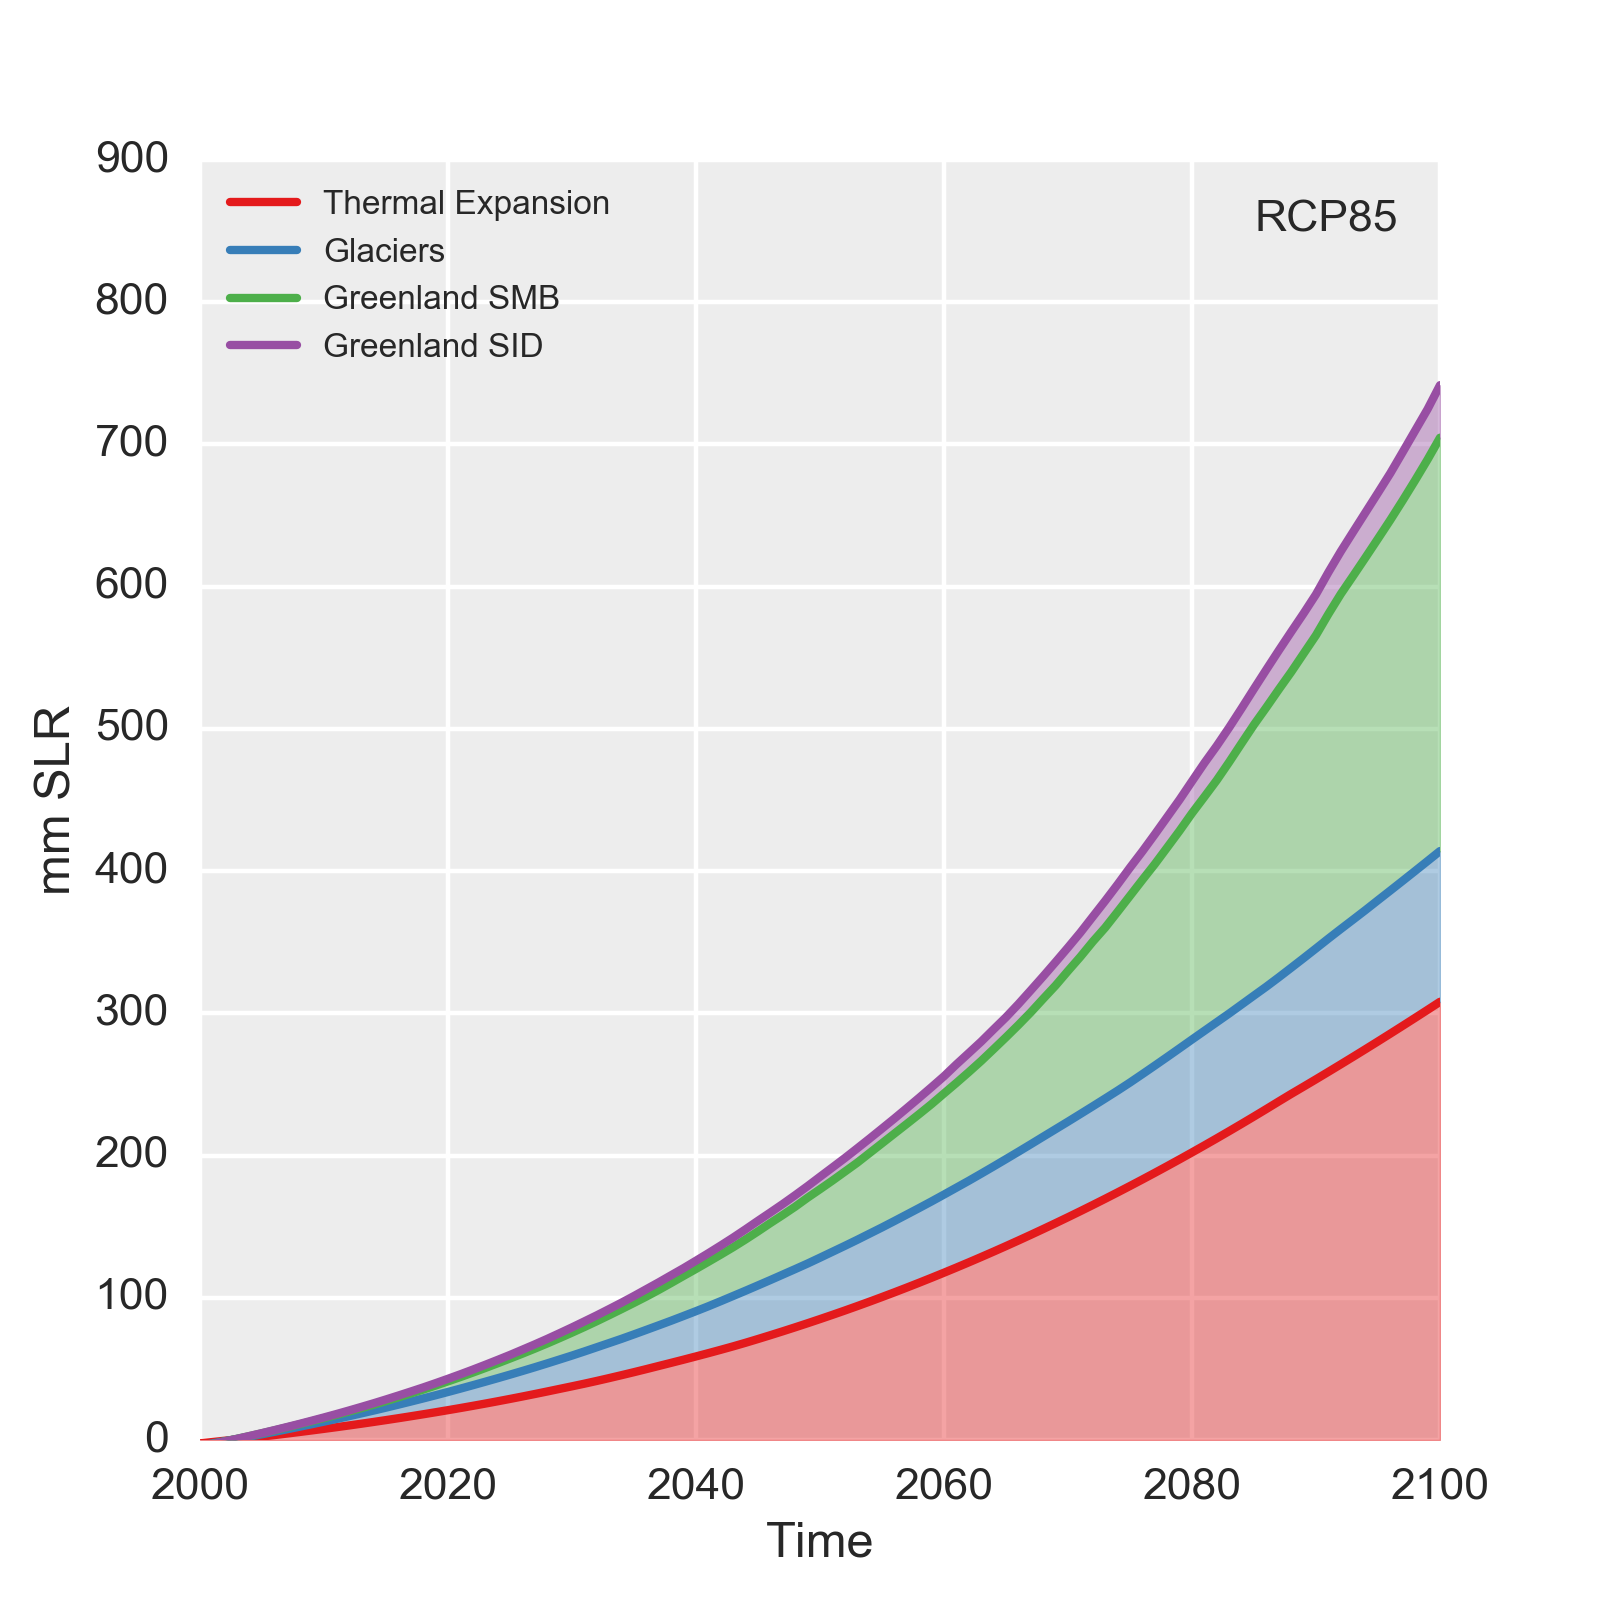
Output of sea level projection model in millimeters sea level rise (many python packages)
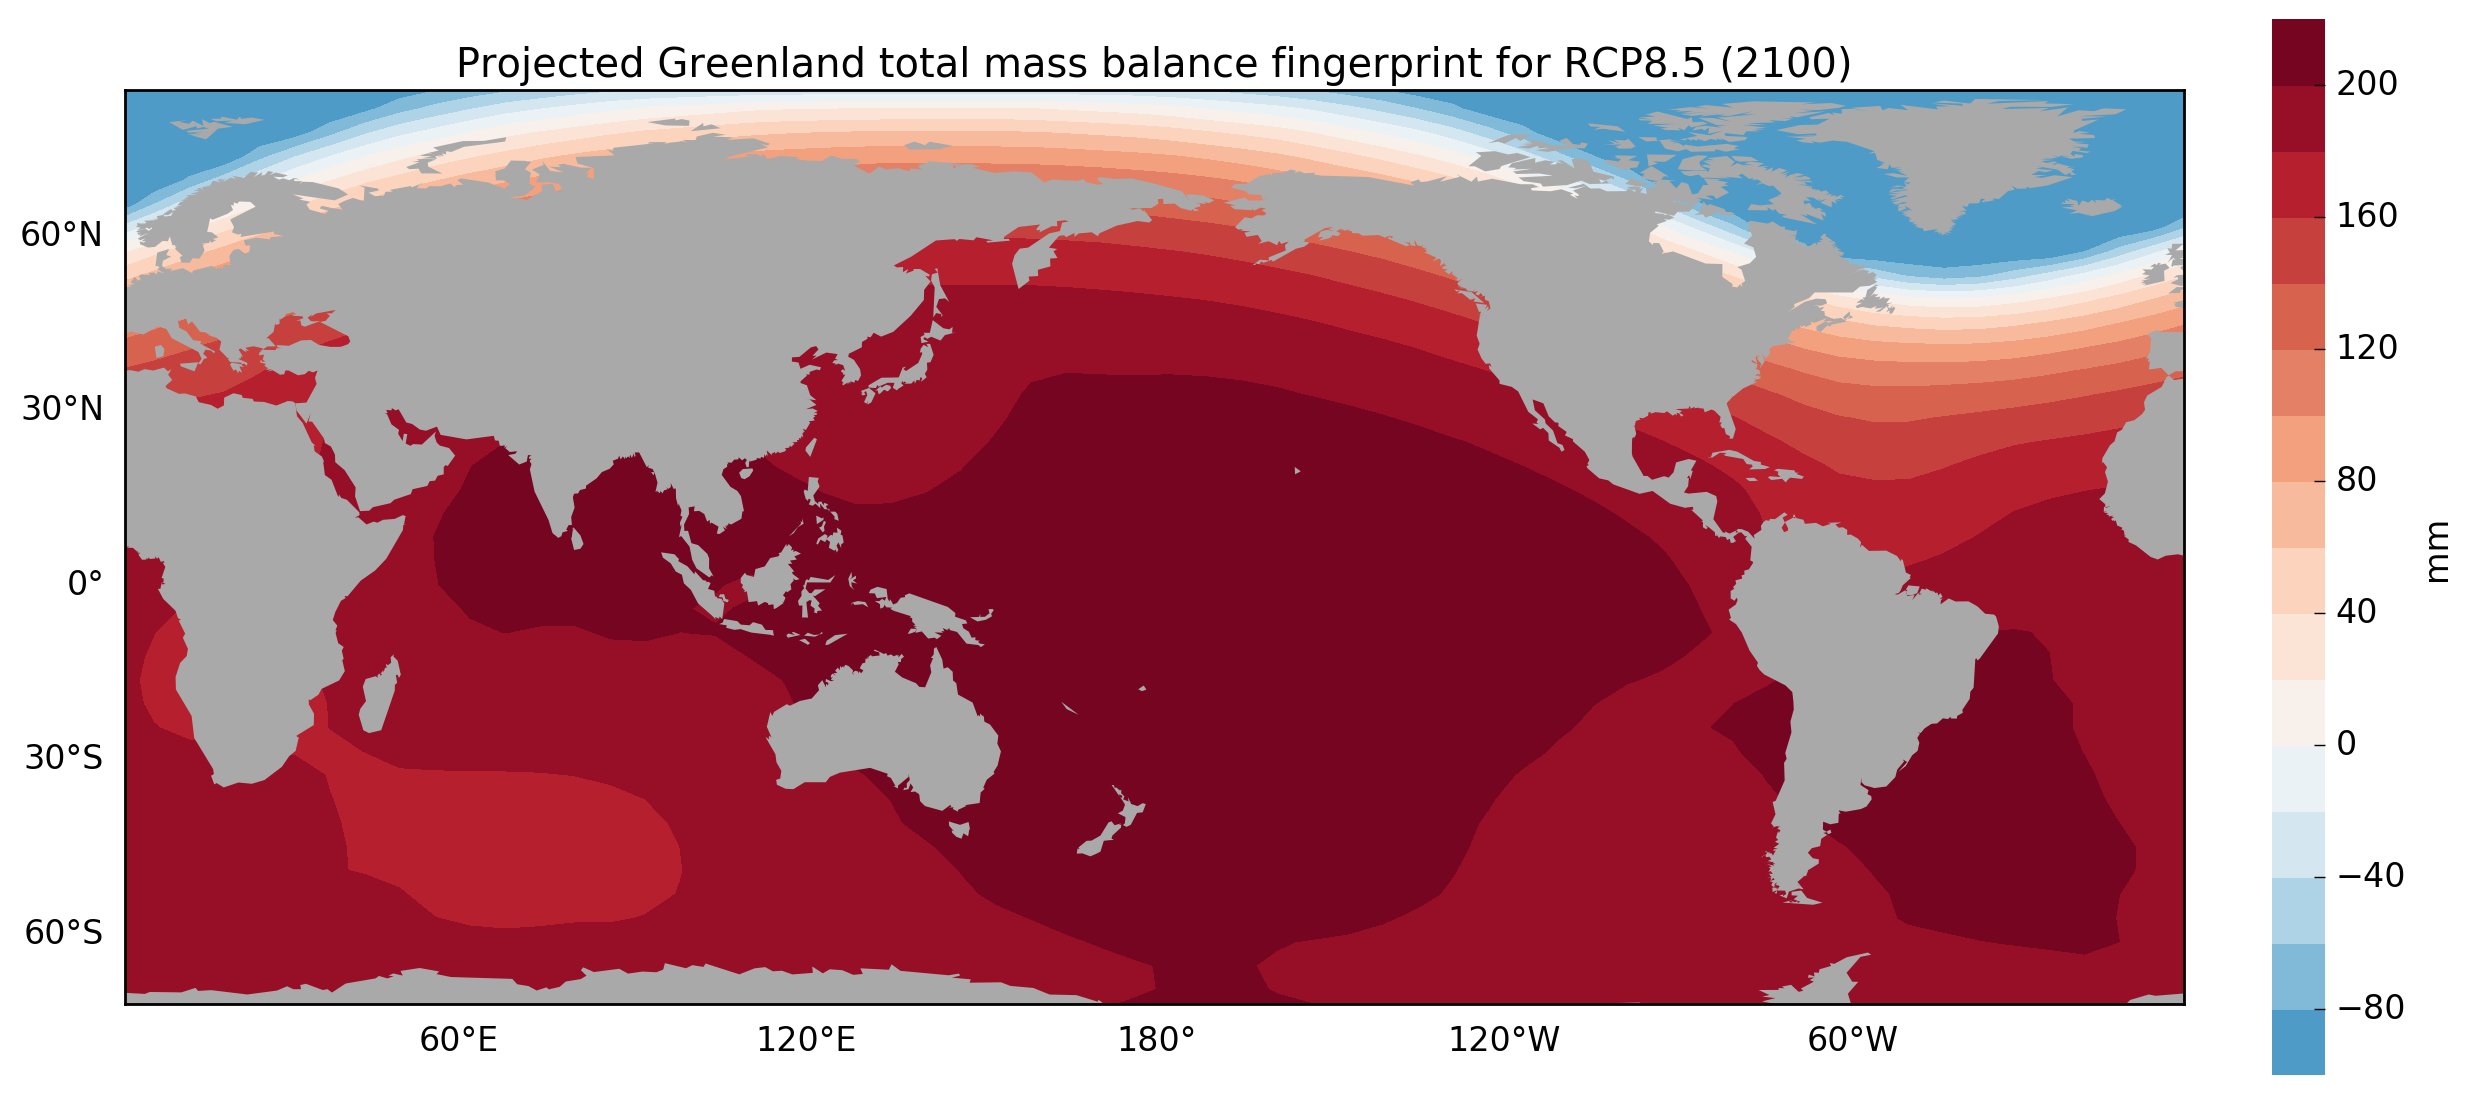
Projected regional contribution of Greenland to sea level rise (analysis in Matlab, plotted in matplotlib)
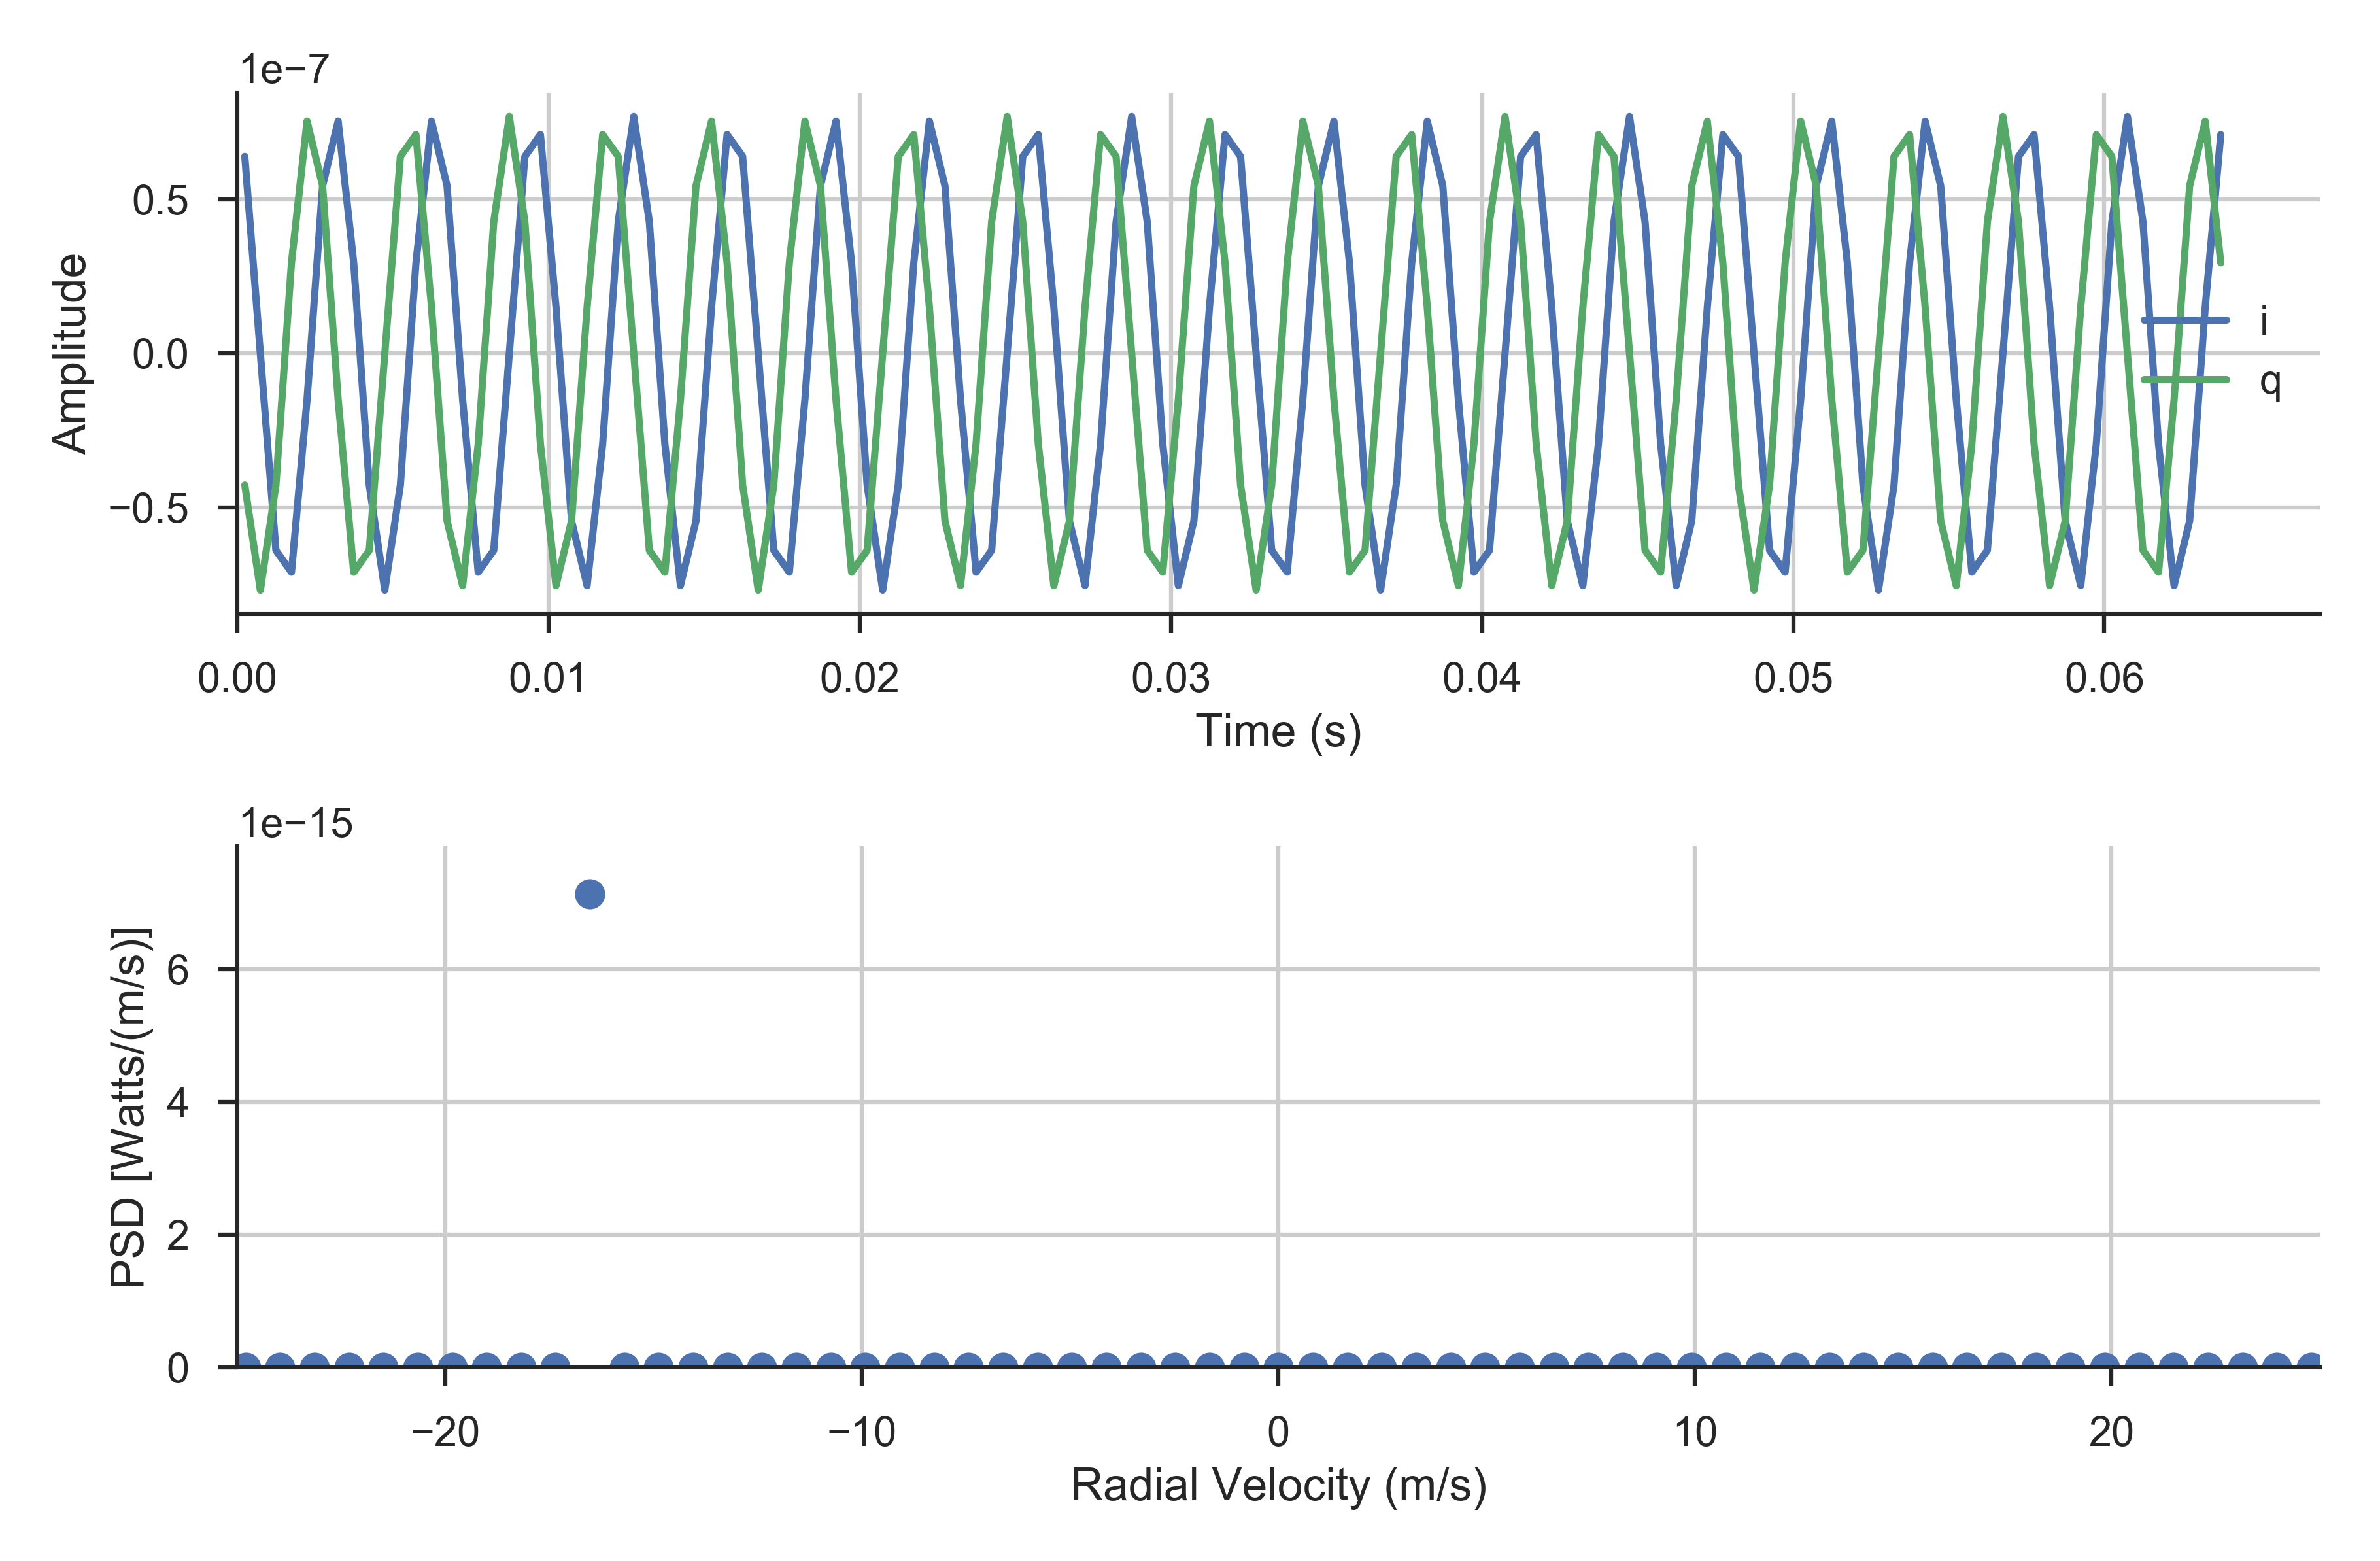
Simulated in phase and quadrature components of radar return signal and target radial velocity from FFT (numpy fft, matplotlib)
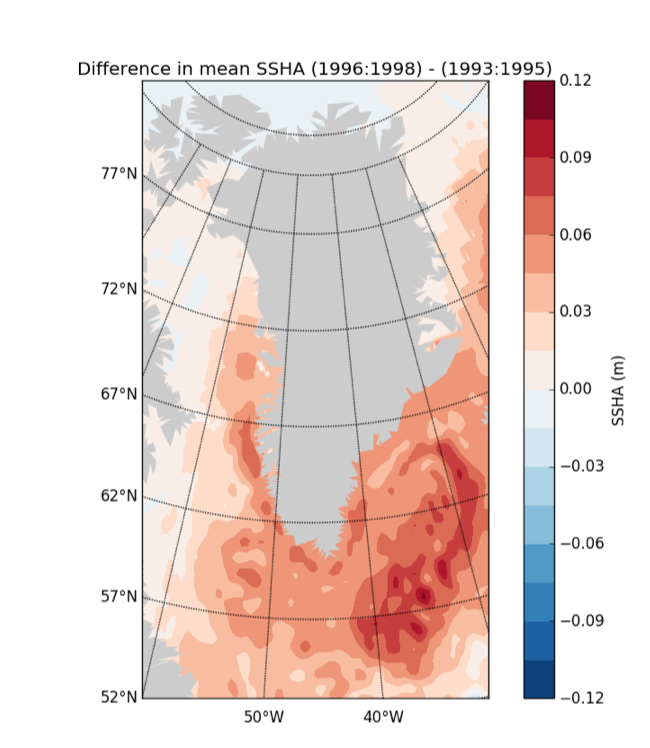
Difference in sea surface height as measured from satellites ([1996-1998] -[1993-1995]) (numpy, matplotlib)
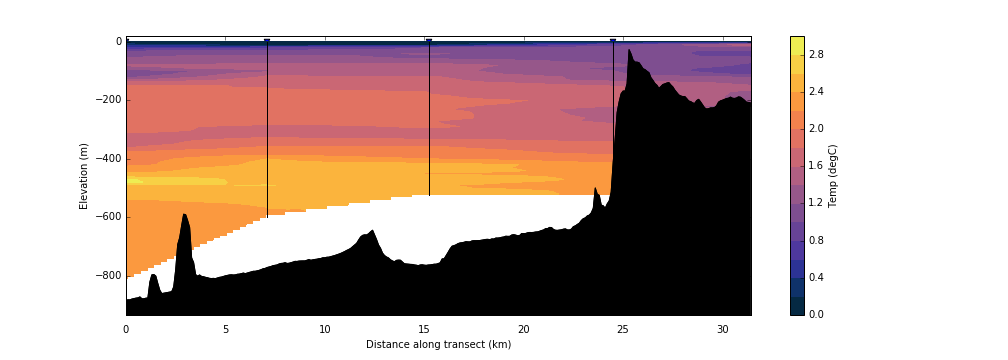
Interpolated profile of ocean temperatures in a Greenland fjord with bathymetry data (numpy, scipy, matplotlib).
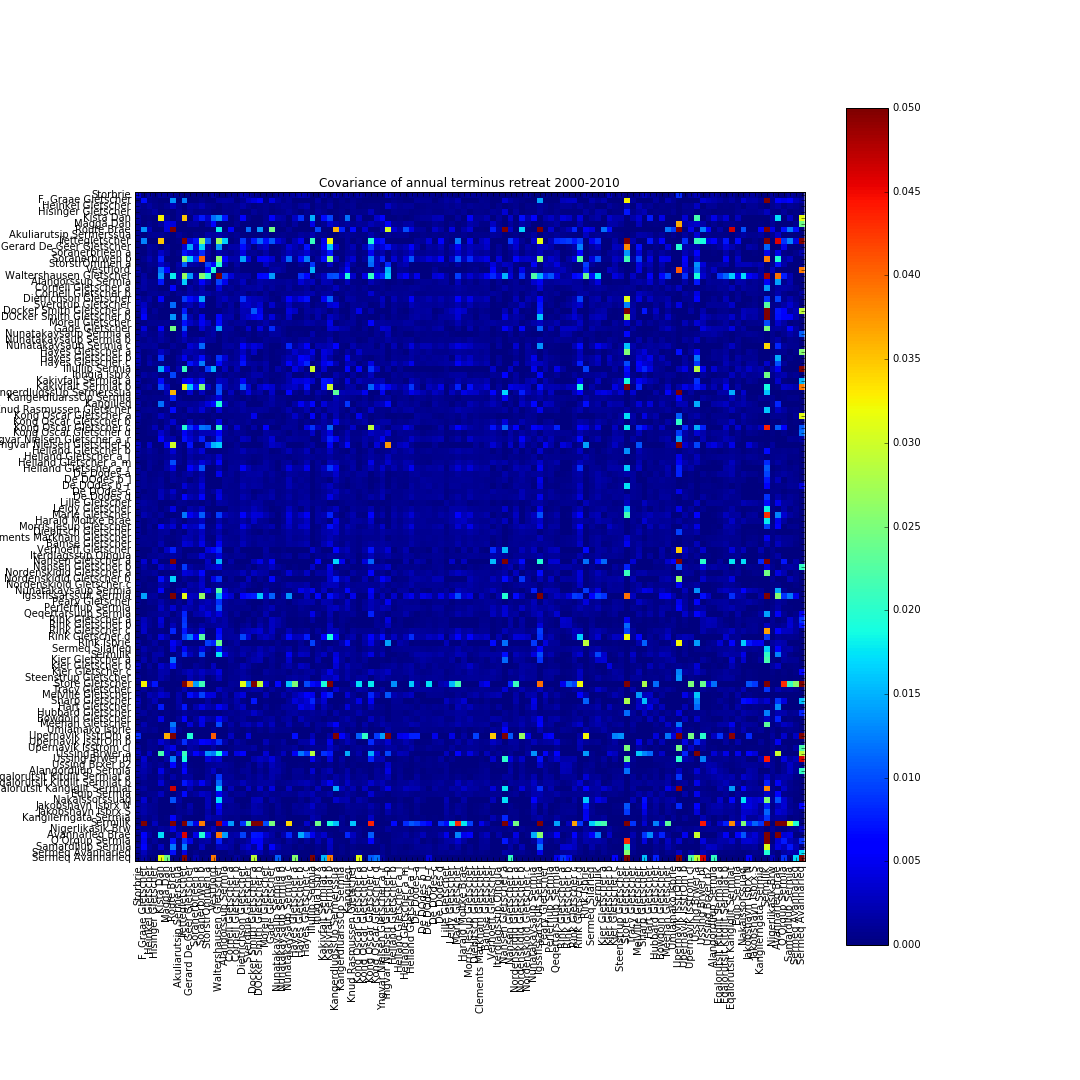
Covariance of retreat rates for large number of Greenland glaciers (numpy, matplotlib)
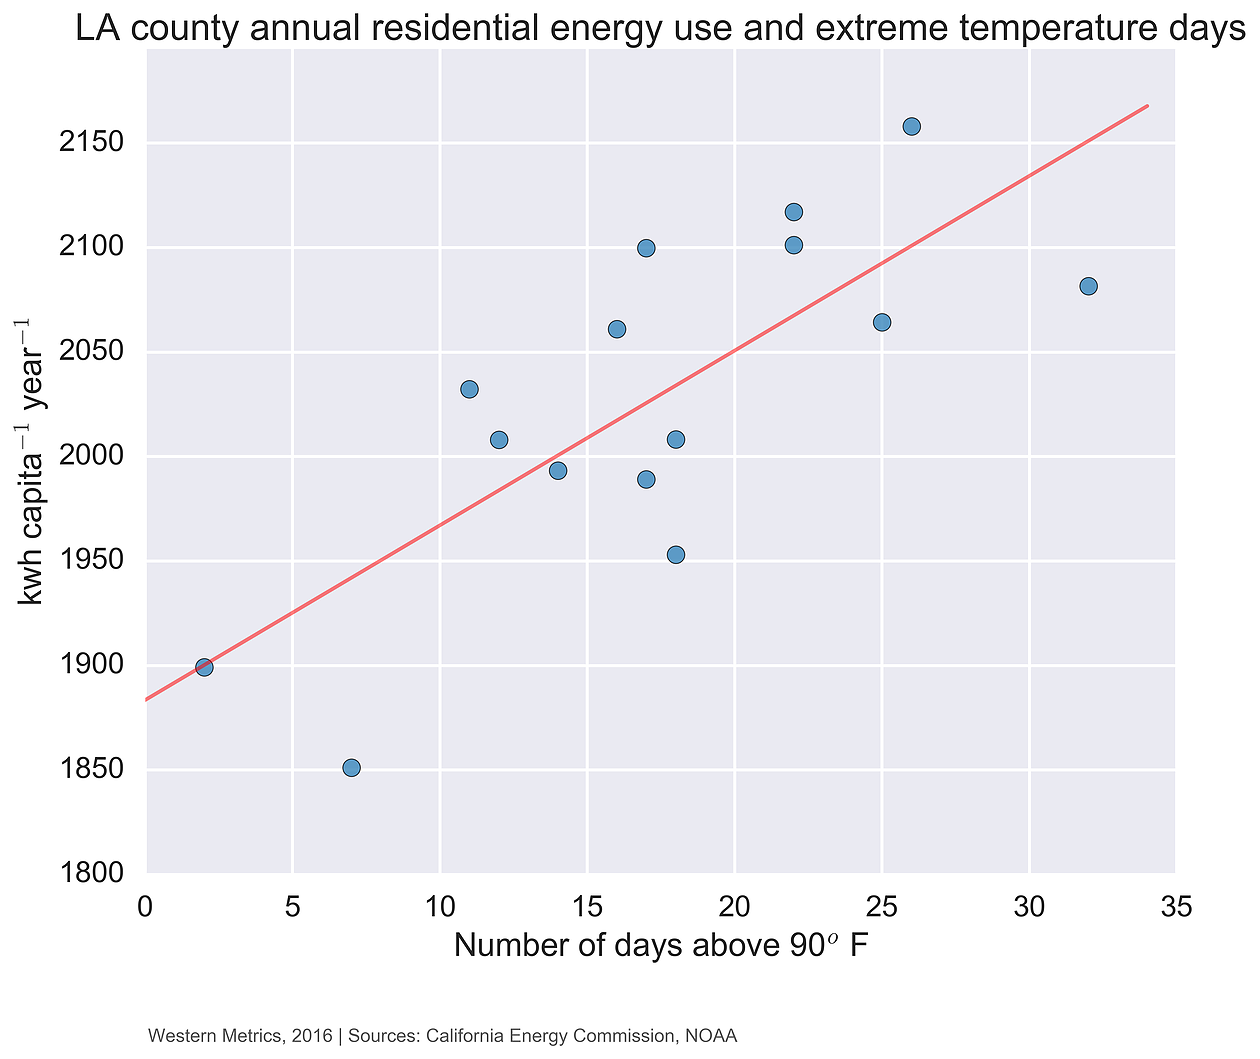
Comparison of L.A. energy use and extreme temperature days (numpy, matplotlib)
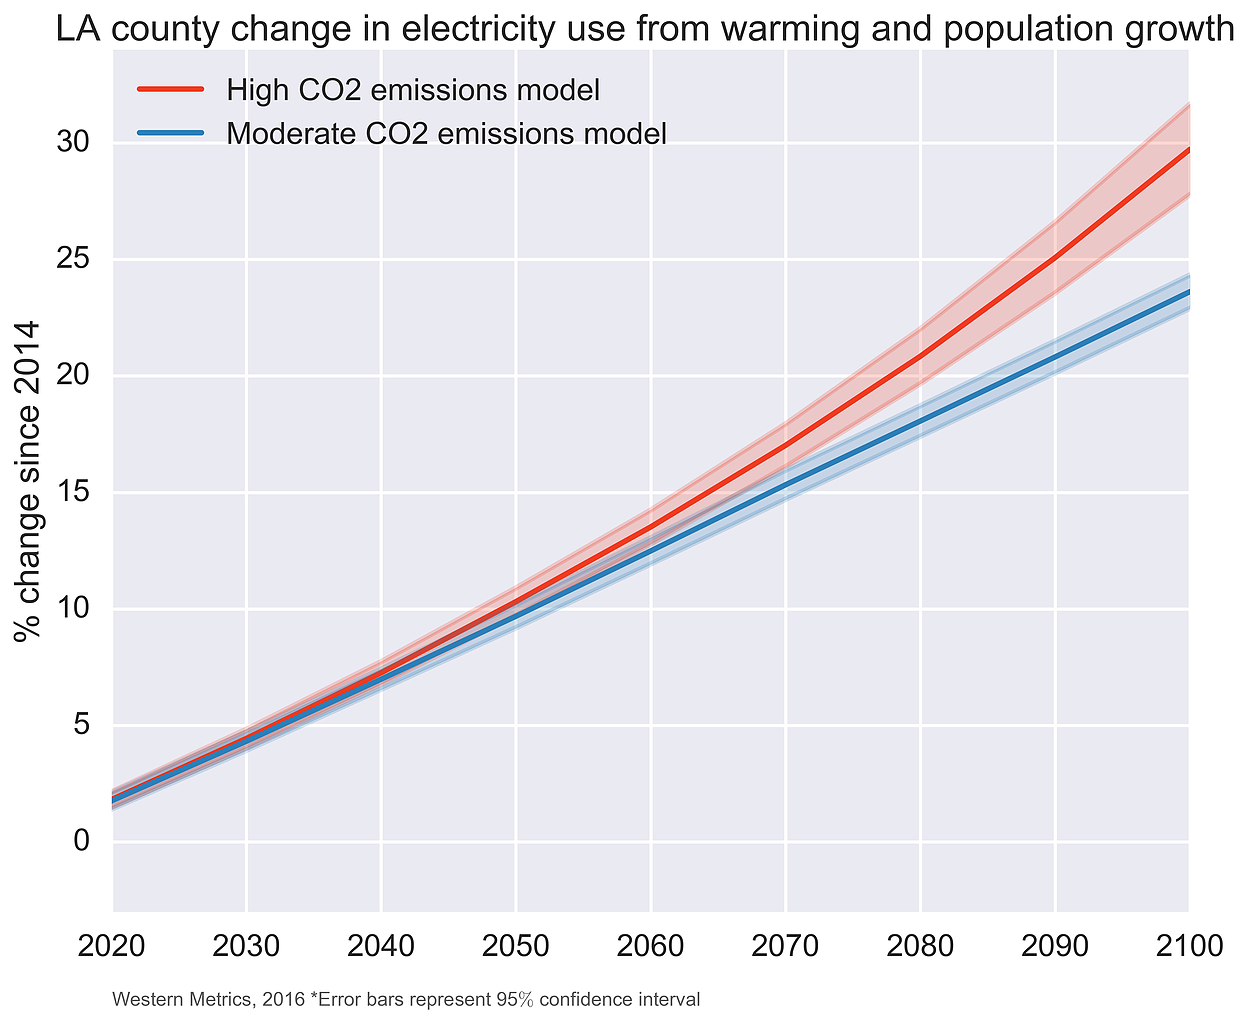
Projection of climate and population driven change in L.A. energy use (numpy, matplotlib)
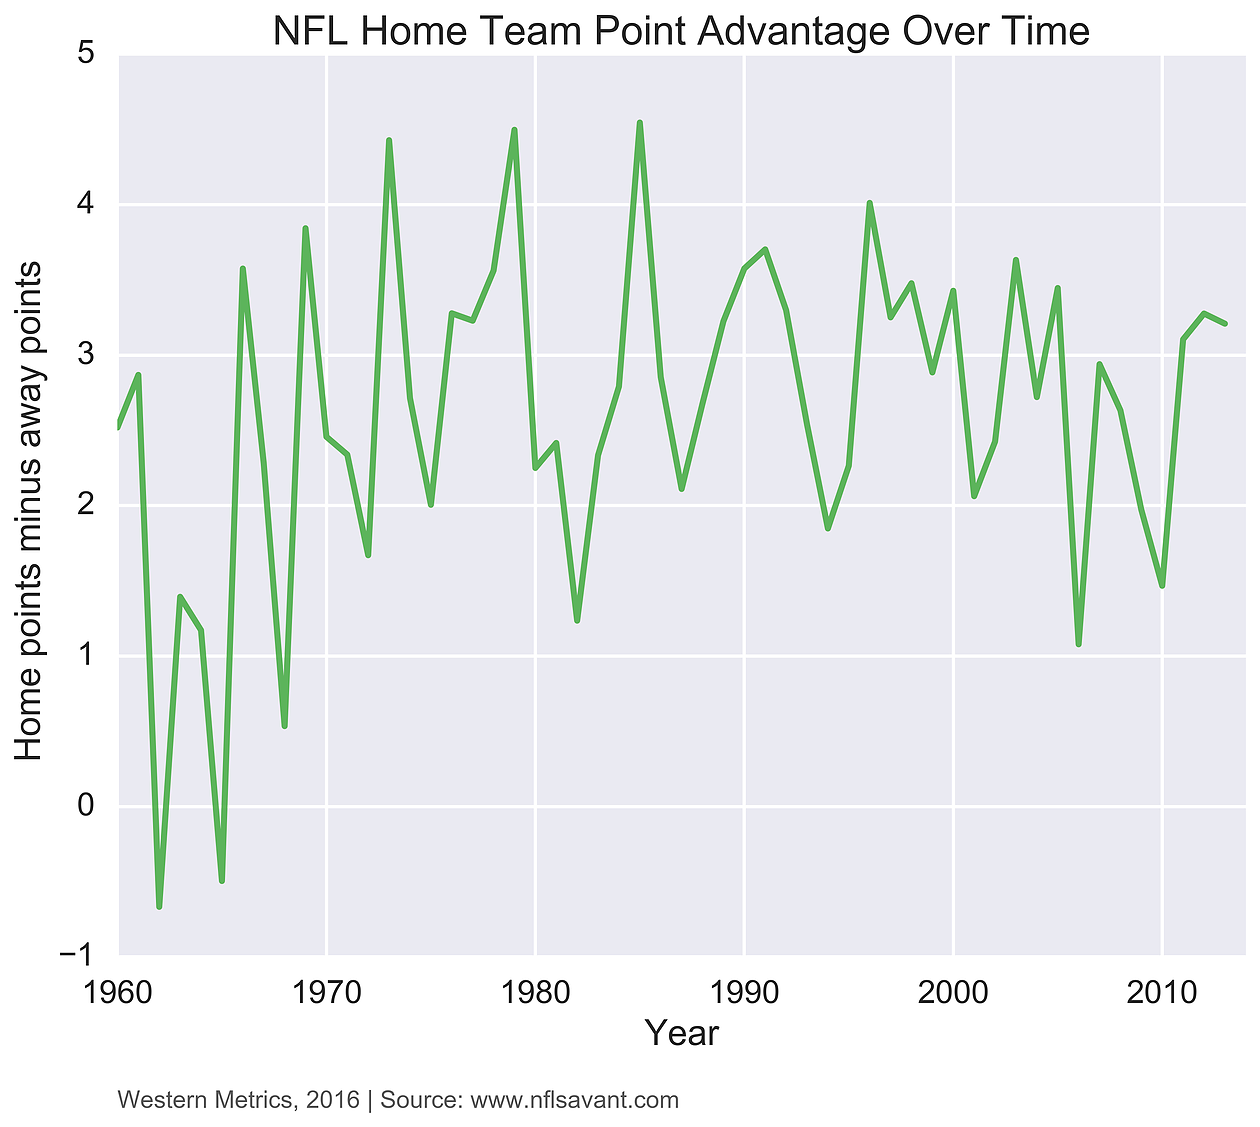
NFL home team scoring advantage over time (numpy, matplotlib)
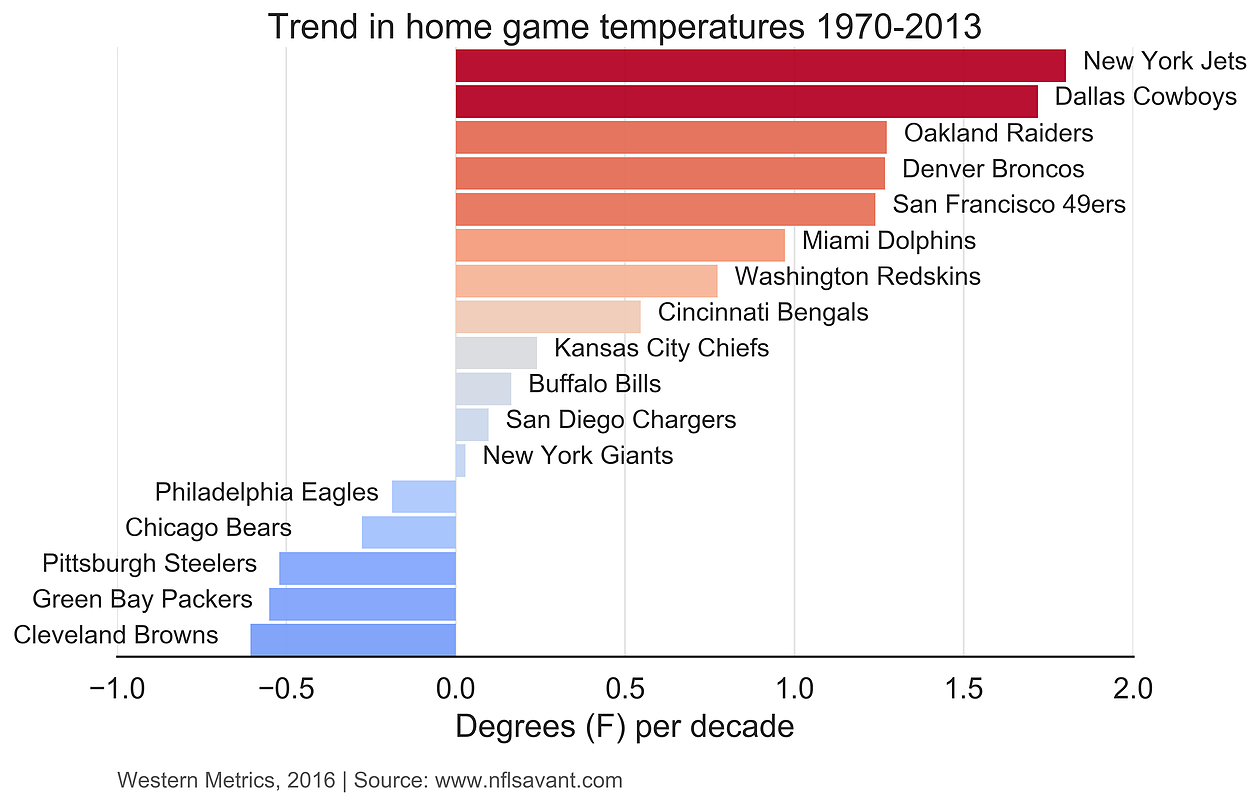
Change in NFL game temperatures over time (numpy, matplotlib)

Visualisation of cellular automata model propagation (numpy, matplotlib)
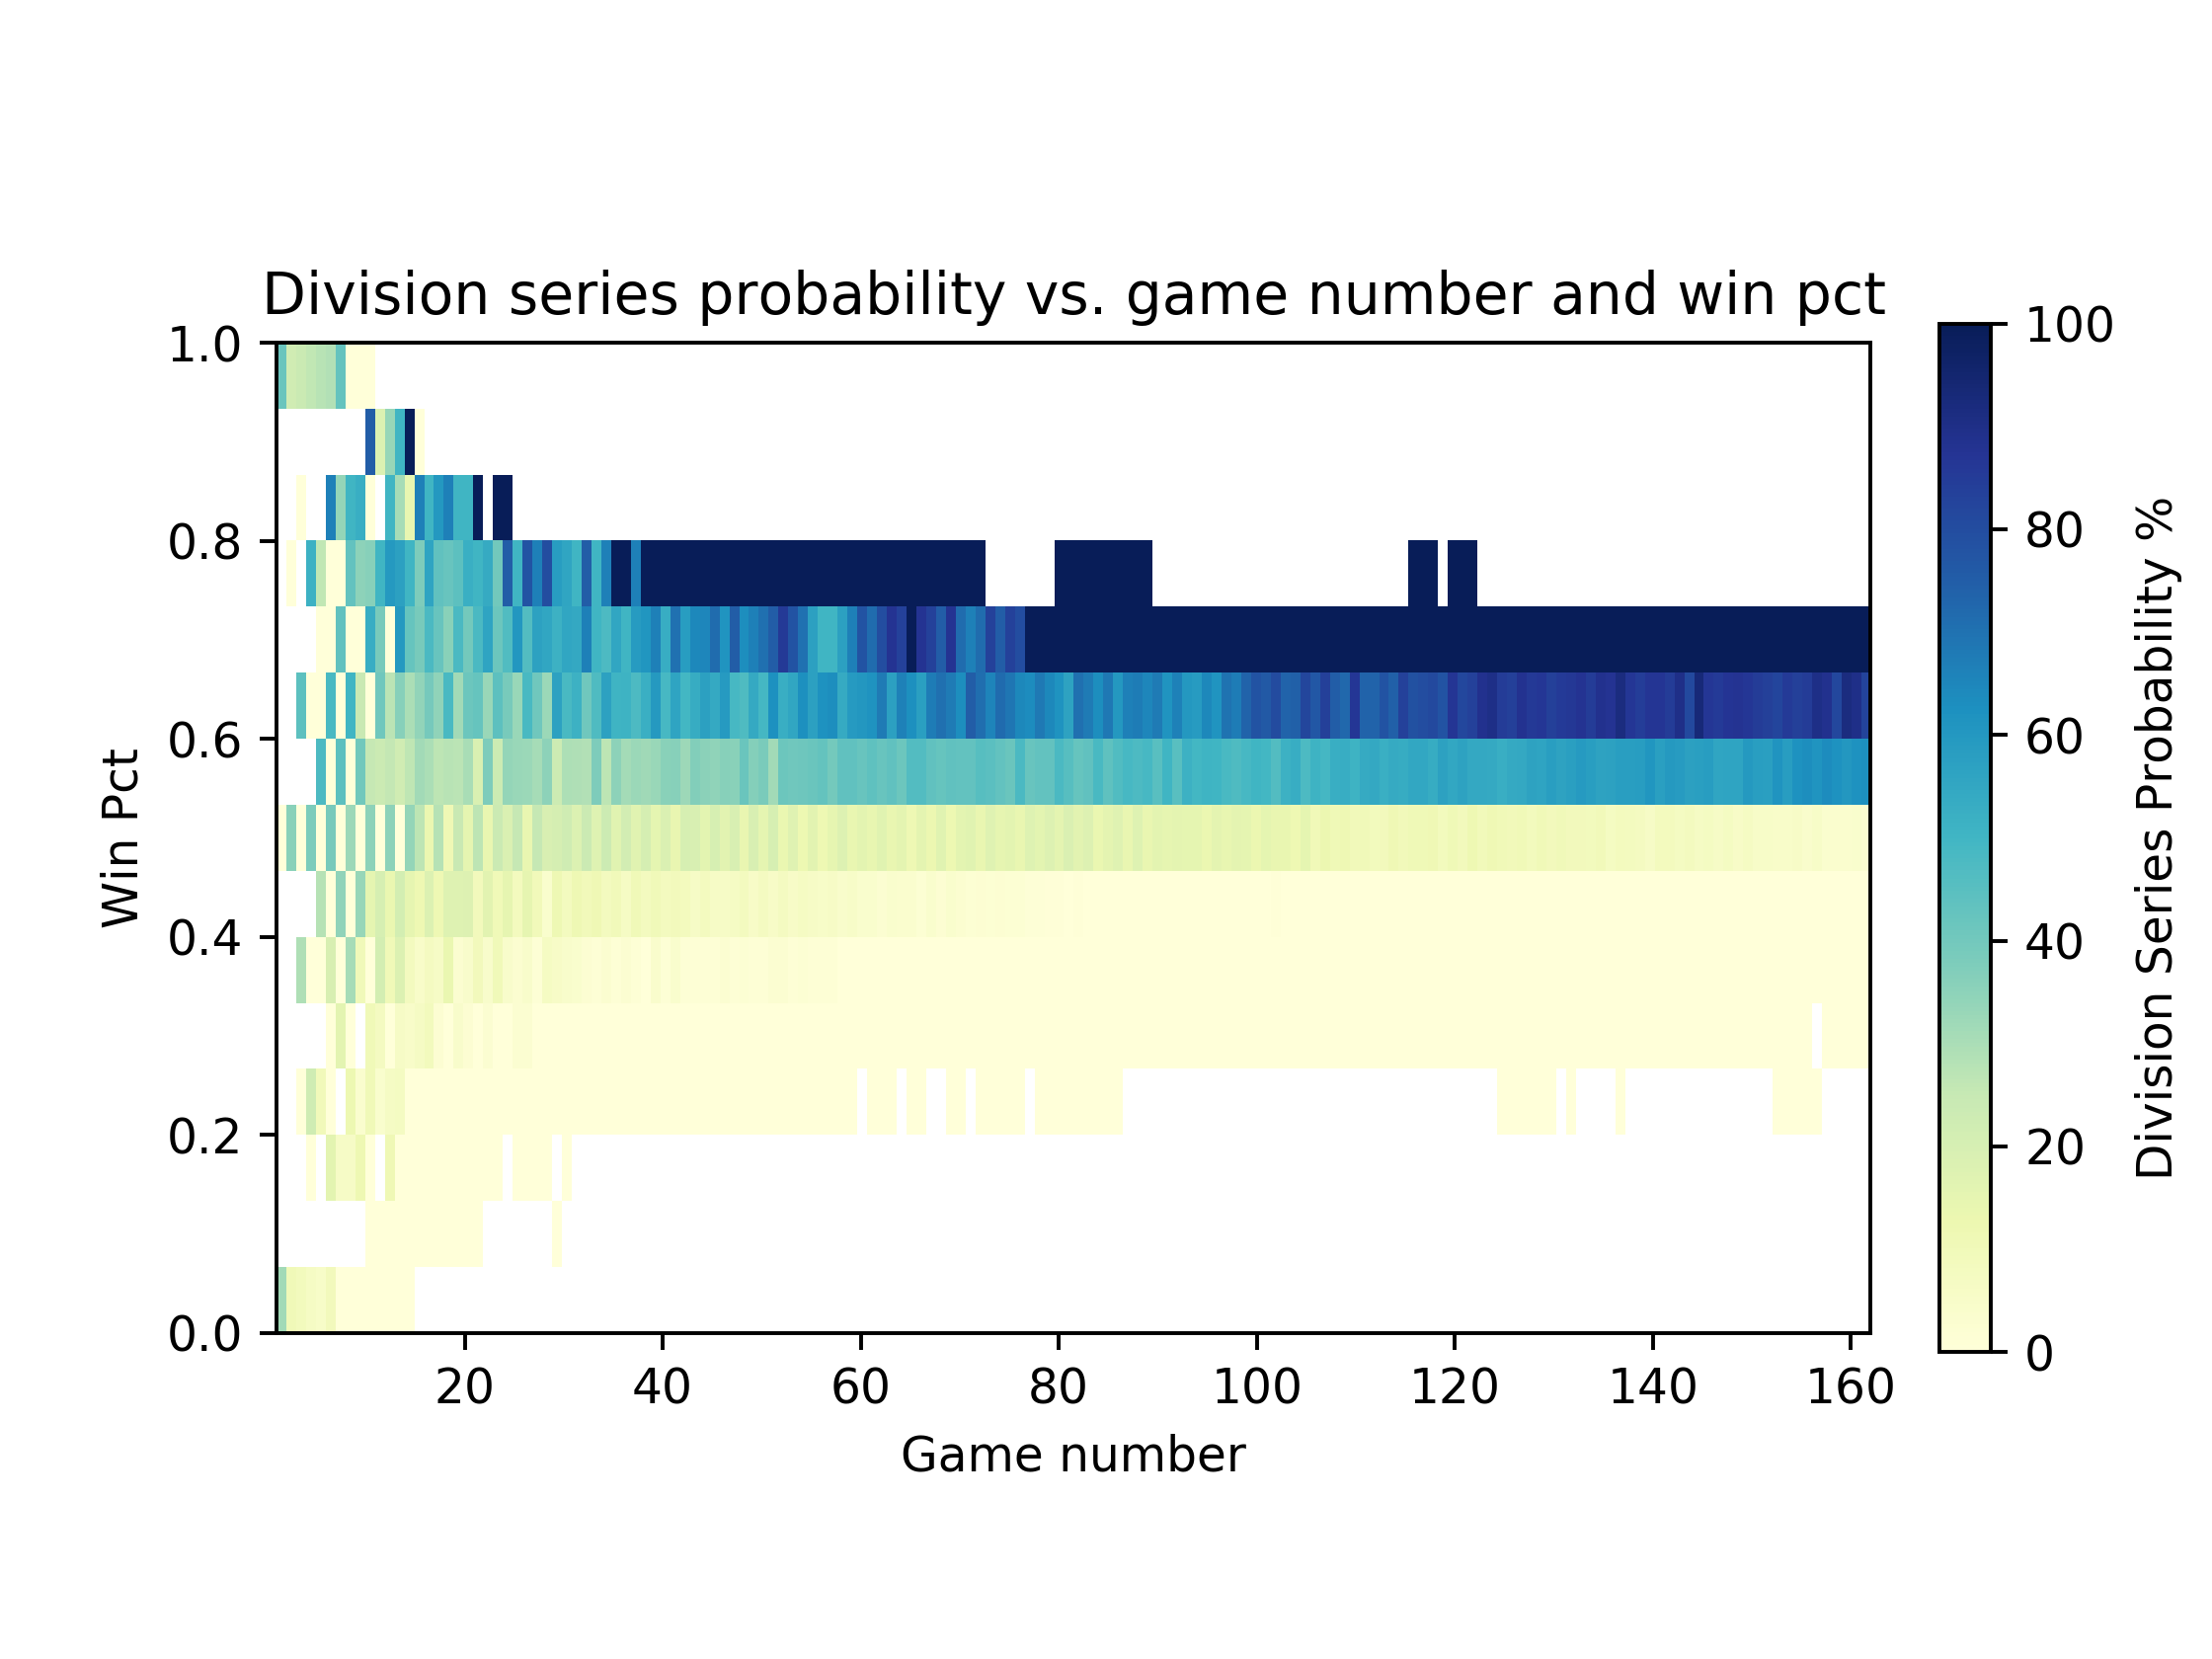
A team's chance of making the MLB playoffs over time as function of win percentage (numpy, matplotlib)
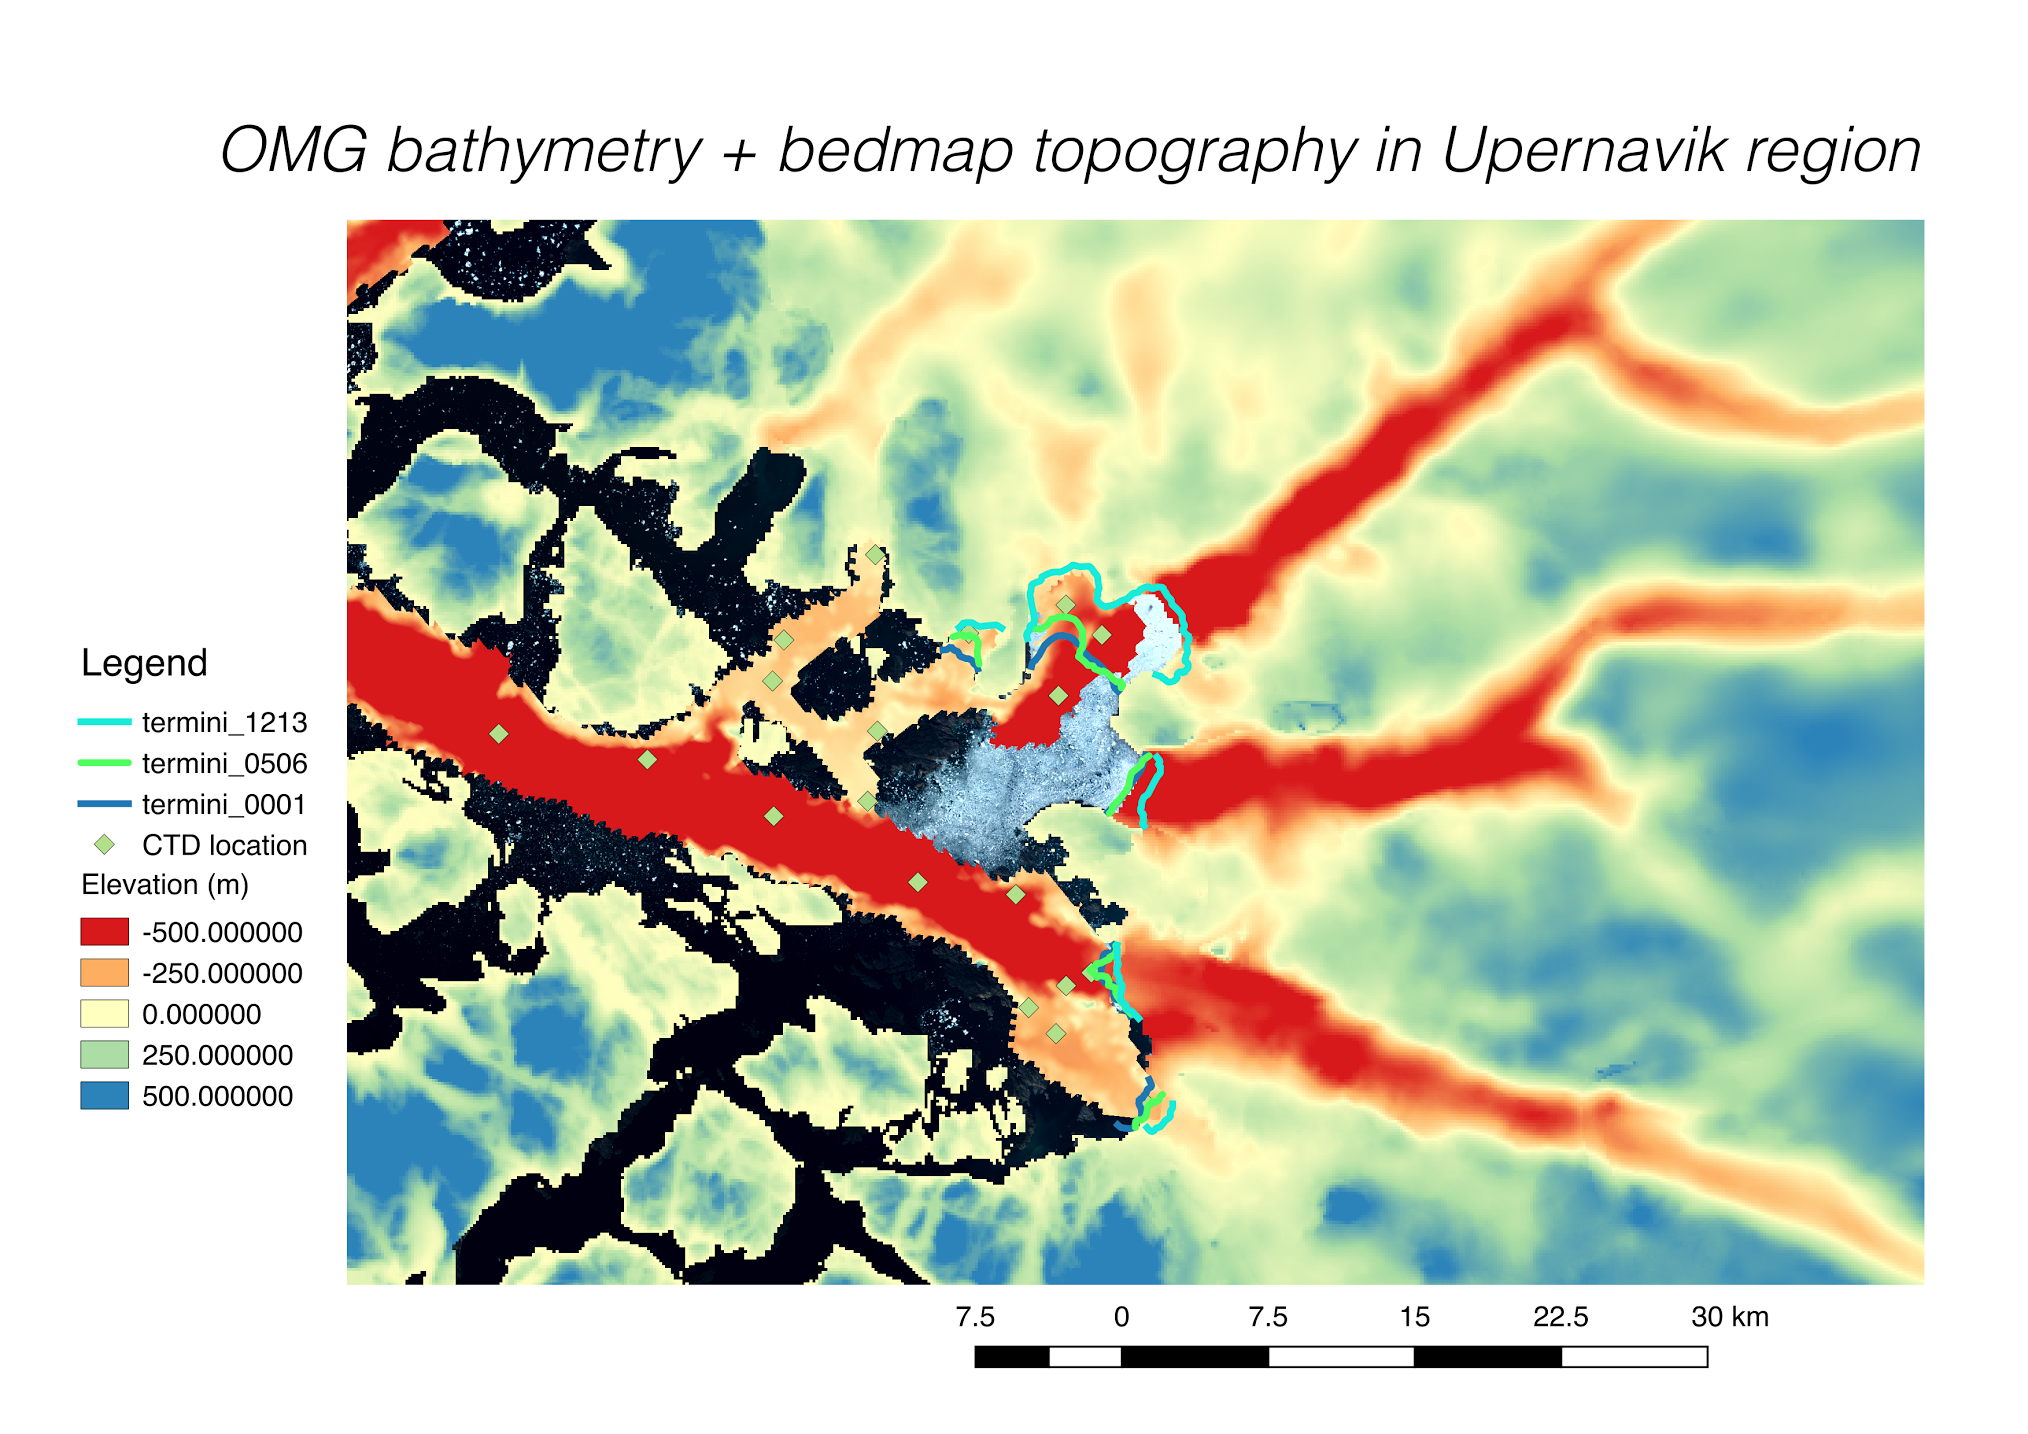
Bathymetry of a greenland fjord combined with estimated bed depth and past terminus positions (qgis)
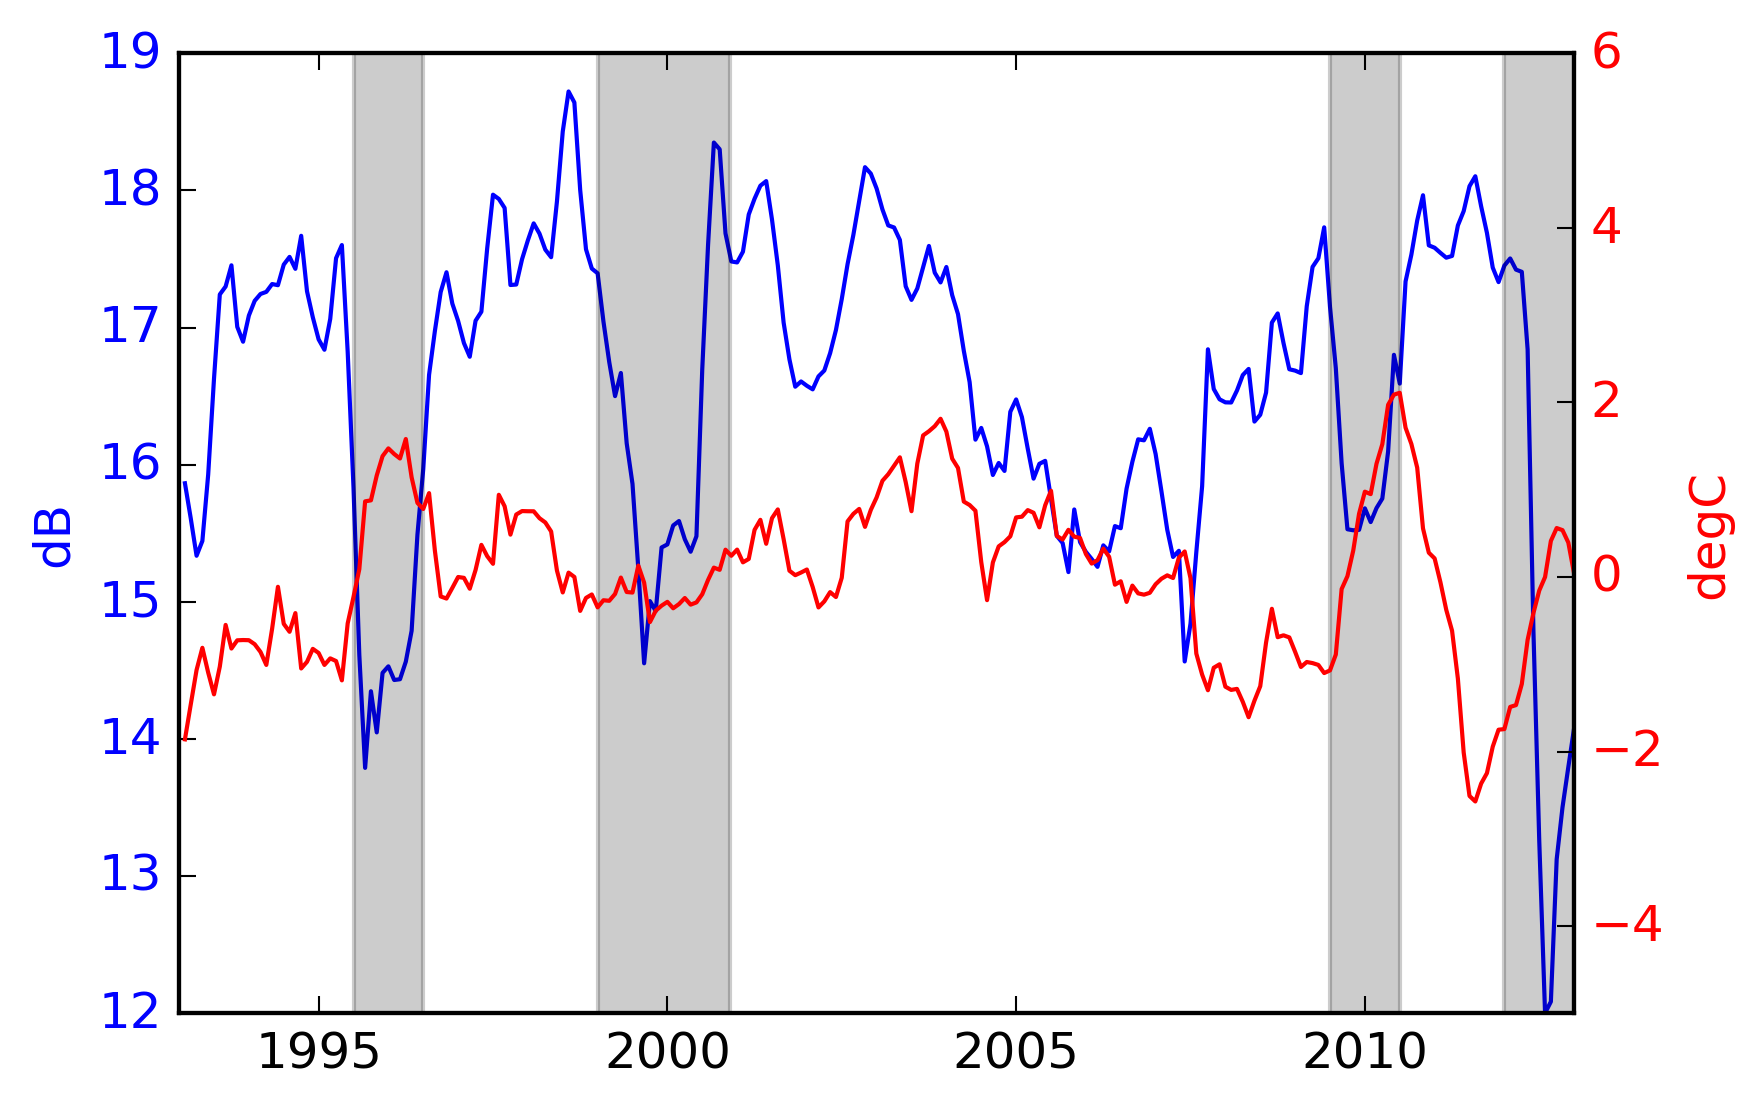
Mean radar backscatter returns over the Greenland ice sheet (blue) compared to mean surface temperatures (red) (numpy, matplotlib)
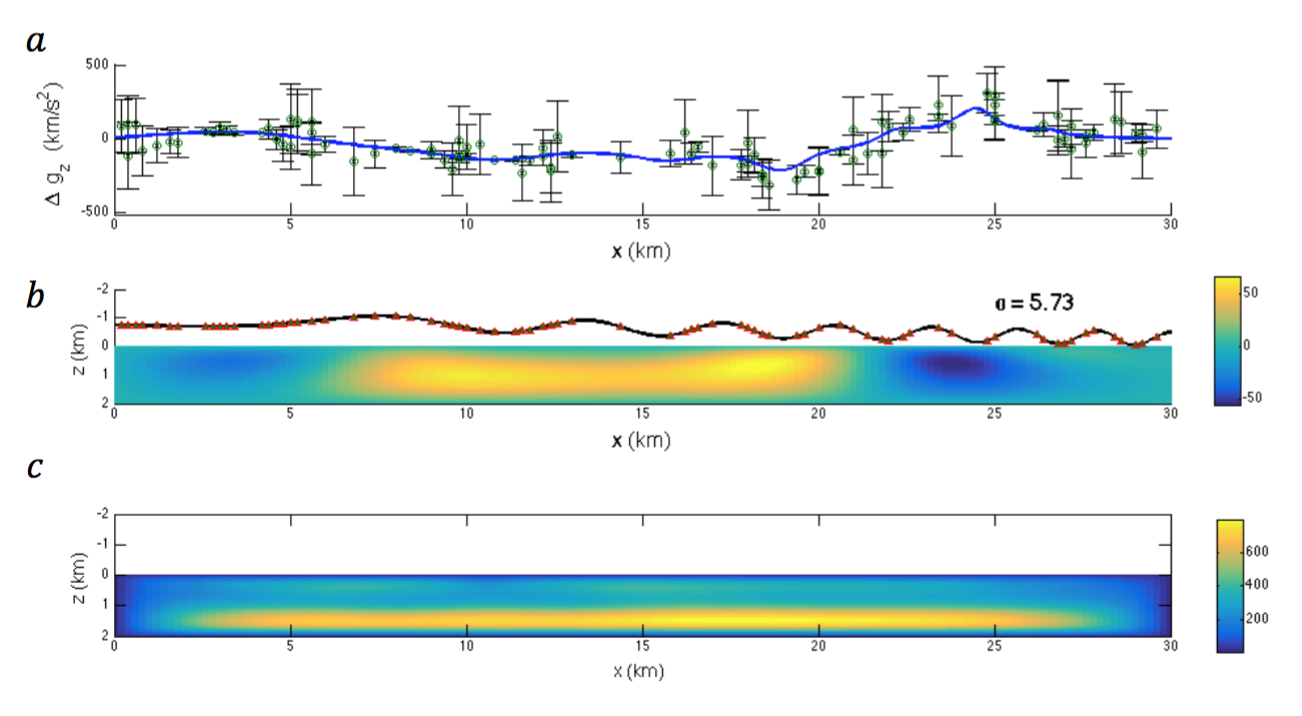
Least squares inversion of 1D synthetic gravity survey (matlab)
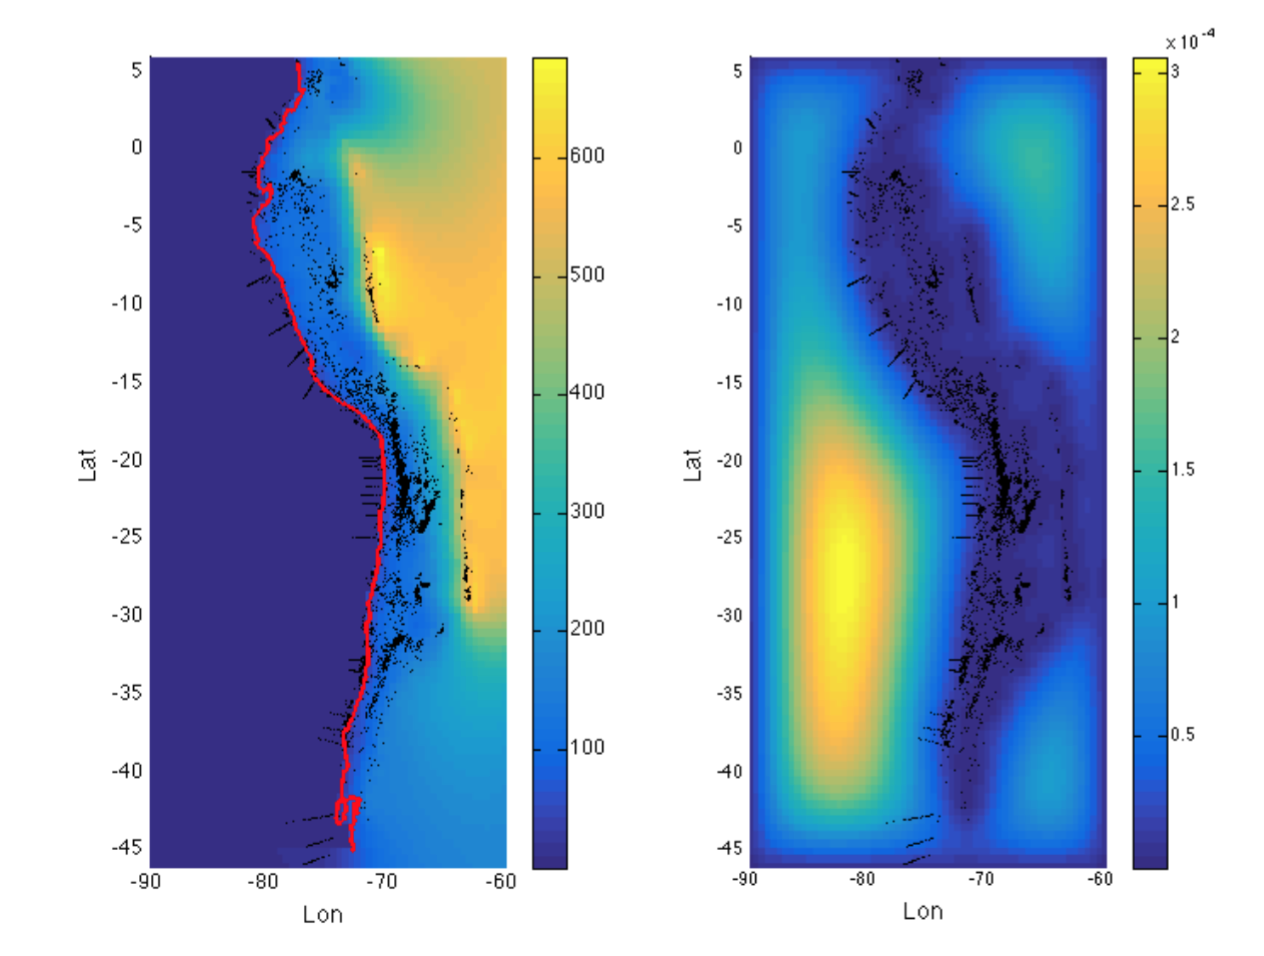
Least squares inversion of slab depth from earthquake epicenters and a-priori model (matlab)